USD/CHF Price Forecast: Double top threatens 0.8220 support
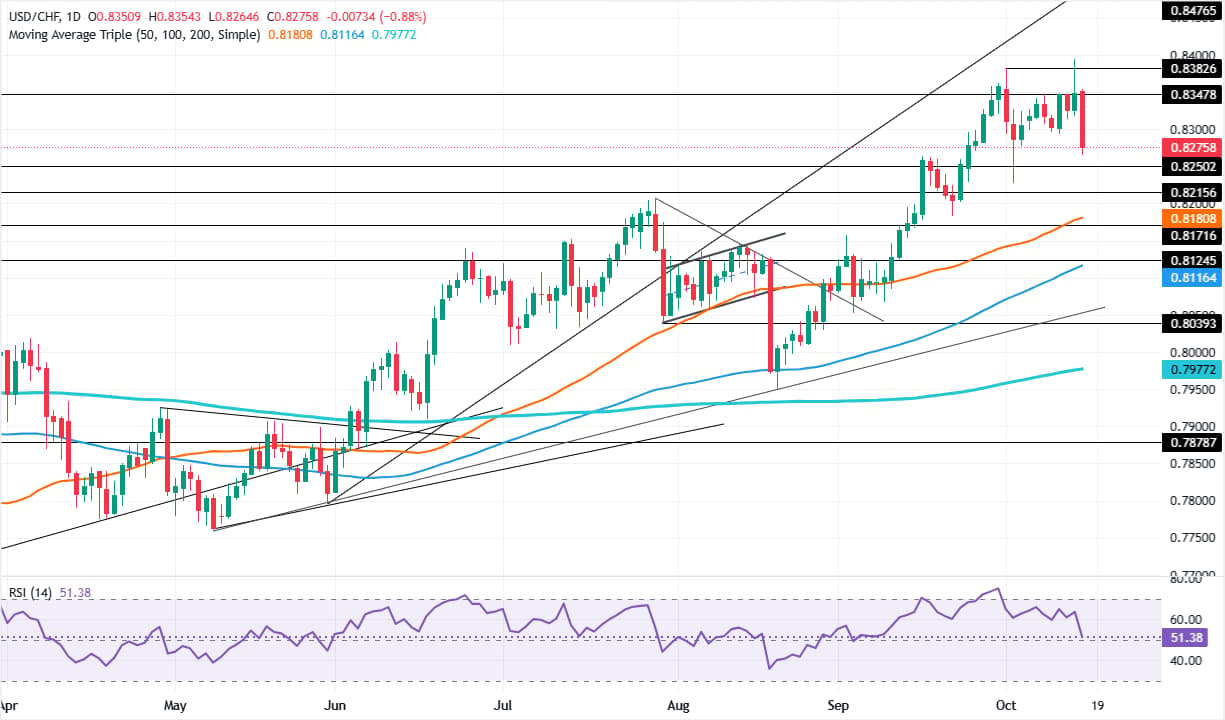
- USD/CHF tumbles below 0.8300 after failing to conquer 0.8400.
- RSI approaches bearish territory, signaling weakening bullish momentum.
- Break below 0.8227 confirms double top, exposing 0.8189 and 0.8116.

The USD/CHF pair struggles at 0.8250 on Thursday, diving below the 0.8300 figure as a ‘double top’ chart pattern looms on the daily chart, even though the overall trend is up. At the time of writing, the pair trades at 0.8269, down almost 1%.
USD/CHF Price Forecast: Technical outlook
The uptrend remains intact, as the market structure of higher highs and higher lows holds so far. Nevertheless, USD/CHF failed to conquer 0.8400 on Wednesday, exacerbating the pair’s drop below 0.8300.
On the other hand, momentum is shifting in favor of sellers, as indicated by the Relative Strength Index (RSI), with the index trending lower and poised to turn bearish.
Nevertheless, if buyers push USD/CHF above 0.8300, this paves the way to challenge the 0.8350 psychological level ahead of the yearly high of 0.8395. Once those levels are taken out, it would open the door to challenge 0.8400.
On the flip side, if USD/CHF extends its loss below the October 2 low of 0.8227, it would confirm the ‘double top’ and open the door for a move towards the 50-day Simple Moving Average (SMA) of 0.8189. The next support is the 100-day SMA at 0.8116.
USD/CHF Price Chart – Daily
(This story was corrected on October 15 at 20:05 GMT to say in the first paragraph that USD/CHF struggles at 0.8250, not 0.8350.)
Swiss Franc Price Today
The table below shows the percentage change of Swiss Franc (CHF) against listed major currencies today. Swiss Franc was the strongest against the Australian Dollar.
| USD | EUR | GBP | JPY | CAD | AUD | NZD | CHF | |
|---|---|---|---|---|---|---|---|---|
| USD | -0.44% | -0.56% | -0.09% | -0.30% | 0.77% | -0.34% | -0.86% | |
| EUR | 0.44% | -0.13% | 0.34% | 0.12% | 1.23% | 0.09% | -0.43% | |
| GBP | 0.56% | 0.13% | 0.46% | 0.25% | 1.33% | 0.22% | -0.31% | |
| JPY | 0.09% | -0.34% | -0.46% | -0.22% | 0.88% | -0.26% | -0.78% | |
| CAD | 0.30% | -0.12% | -0.25% | 0.22% | 1.07% | -0.03% | -0.56% | |
| AUD | -0.77% | -1.23% | -1.33% | -0.88% | -1.07% | -1.10% | -1.63% | |
| NZD | 0.34% | -0.09% | -0.22% | 0.26% | 0.03% | 1.10% | -0.55% | |
| CHF | 0.86% | 0.43% | 0.31% | 0.78% | 0.56% | 1.63% | 0.55% |
The heat map shows percentage changes of major currencies against each other. The base currency is picked from the left column, while the quote currency is picked from the top row. For example, if you pick the Swiss Franc from the left column and move along the horizontal line to the US Dollar, the percentage change displayed in the box will represent CHF (base)/USD (quote).
Author

Christian Borjon Valencia
FXStreet
Markets analyst, news editor, and trading instructor with over 14 years of experience across FX, commodities, US equity indices, and global macro markets.

















