Nike Inc. blue box area offered a buying opportunity

In today’s article, we’ll examine the recent performance of Nike Inc. ($NKE) through the lens of Elliott Wave Theory. We’ll review how the rally from the February 07, 2025, low unfolded as a 5-wave impulse and discuss our forecast for the next move. Let’s dive into the structure and expectations for this stock.
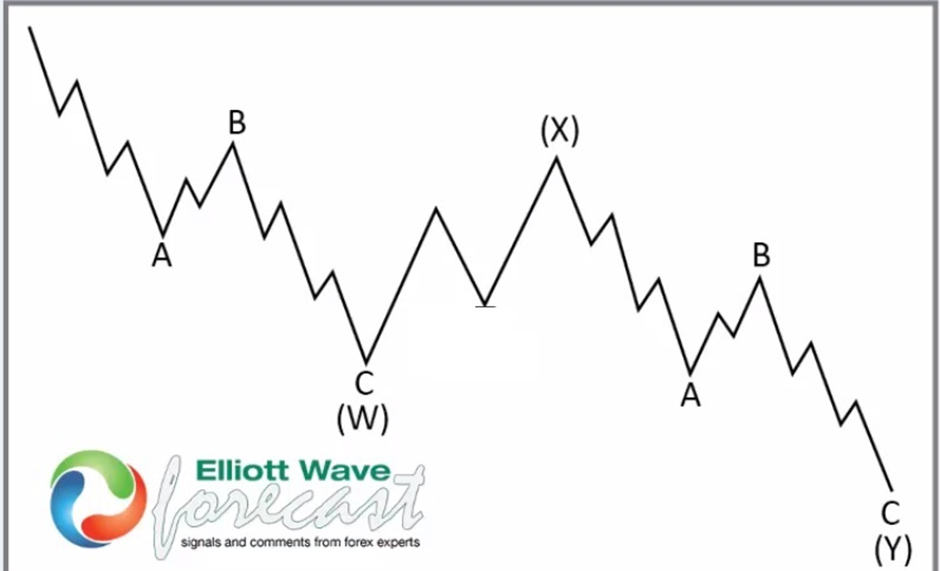
Seven swings WXY correction
$NKE one-hour Elliott Wave chart 3.03.2025
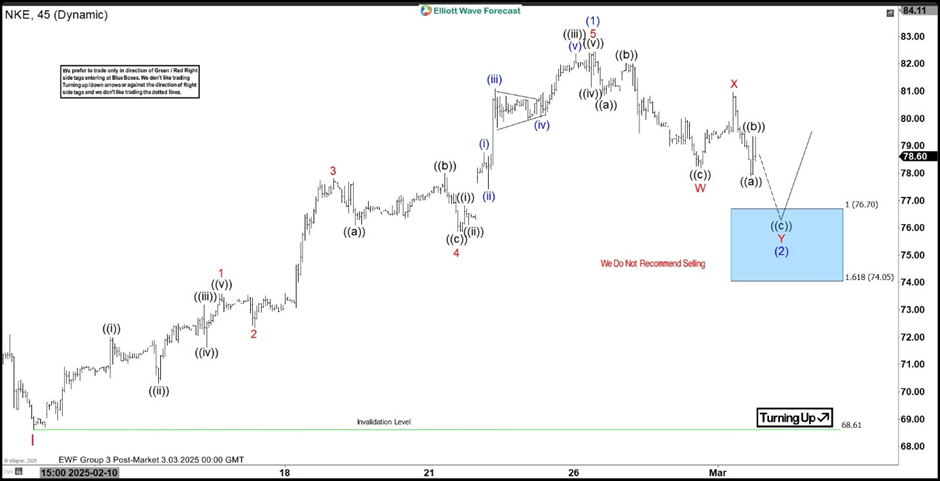
In the 1-hour Elliott Wave count from March 03, 2025, we see that $NKE completed a 5-wave impulsive cycle beginning on February 07, 2025, and ending on February 26, 2025, at the blue (1). As expected, this initial wave prompted a pullback. We anticipated this pullback to unfold in 7 swings, likely finding buyers in the equal legs area between $76.70 and $74.05.
This setup aligns with a typical Elliott Wave correction pattern (WXY), where the market pauses briefly before resuming the main trend.
$NKE one-hour Elliott Wave chart 3.10.2025
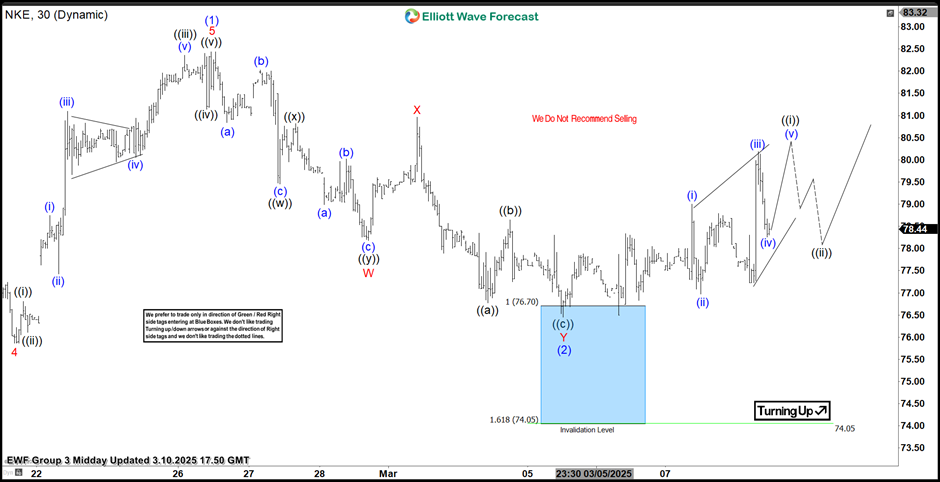
The update, from March 10, 2025, shows that $NKE reacted as predicted. After the decline from the recent peak, the stock found support in the equal legs area, leading to a bounce. As a result, traders could adjust to go risk-free.
Conclusion
In conclusion, our Elliott Wave analysis of Nike Inc. ($NKE) suggested that it could bounce in the short term. Therefore, traders should be risk-free and keep an eye out for any corrective pullbacks. By using Elliott Wave Theory, we can identify potential buying areas and enhance risk management in volatile markets.
Author

Elliott Wave Forecast Team
ElliottWave-Forecast.com


