|

NextEra Energy (NEE) should expect bounce from inflection area

NextEra Energy, Inc., (NEE) through its subsidiaries generates, transmits, distributes & sells electric power to retail & wholesale customers in North America. The company generates electricity, through wind, solar, nuclear, natural gas & other clean energy. It comes under Utility sector & trades as “NEE” ticker at NYSE.

As shown in the last article, NEE shown impulse sequence of I ended at $86.10 high. Below there, it favors pullback in II in double three correction against October-2023 low before rally continue. It favors pullback towards $65.86 – $57.50 area before turning higher either in ((X)) or may be new rally.

NEE – Elliott Wave latest weekly view

NEE

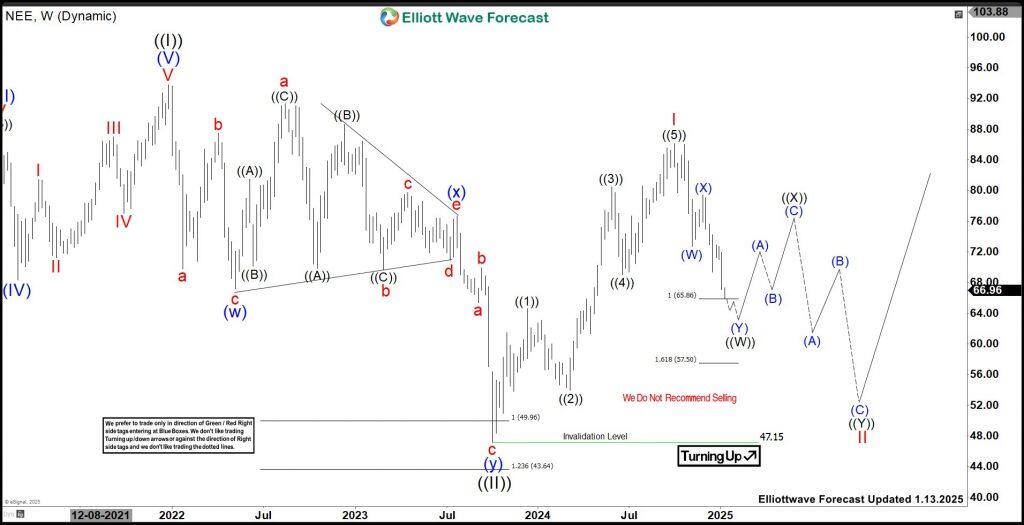
In Weekly, it ended ((I)) sequence at $93.73 high in December-2021. Below, it ended ((II)) at $47.15 low in October-2023 as double three correction. Within ((II)), it placed (w) at $67.22 low as 3 swing pullback, (x) as triangle connector ended at $76.67 high & (y) at $47.15 low in extreme areas. Above there, it favors upside in ((III)) sequence, which confirms when break above $93.73 high.

NEE – Elliott Wave weekly view from 10.07.2024

Chart

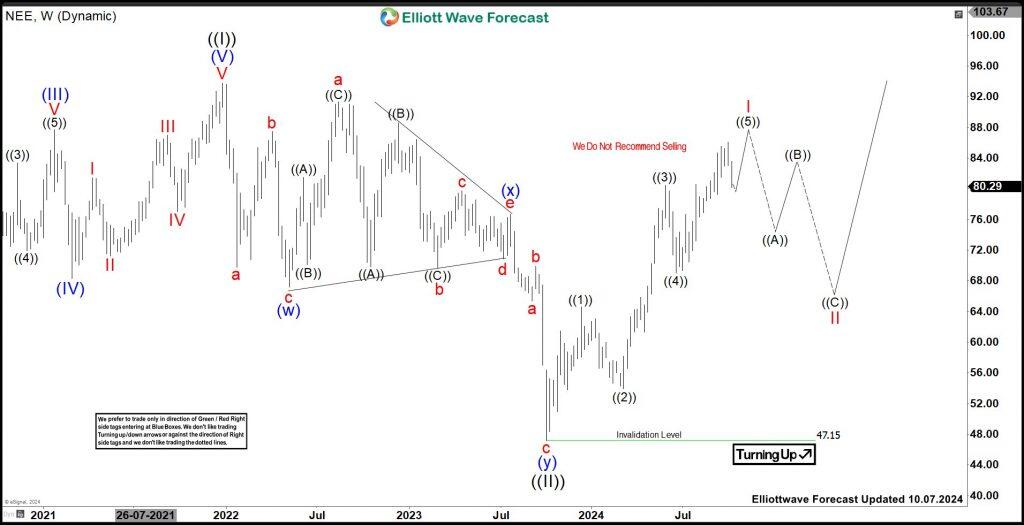
Since October-2023 low, it ended I impulse at $86.10 high in September-2024. Within I, it placed ((1)) at $64.59 high, ((2)) at $53.95 low, ((3)) at $80.47 high, ((4)) at $68.97 low & finally ((5)) at $86.10 high. Currently, it favors double three correction lower in II. It placed (W) at $72.69 low, (X) at $79.38 high & favors lower in (Y) towards $65.86 – $57.50 area to finish ((W)) of II. Buyers should take control from the extreme areas to bounce either in ((X)) or upside in III, which confirms above I high. In any situation, it should see at least 3 swing bounce soon towards $70 or higher levels.

Author

Elliott Wave Forecast Team

Elliott Wave Forecast Team

ElliottWave-Forecast.com

More from Elliott Wave Forecast Team
Share:

Editor's Picks

EUR/USD deflates to fresh lows, targets 1.1600

The selling pressure on EUR/USD now gathers extra pace, prompting the pair to hit fresh multi-week lows in the 1.1625-1.1620 band on Friday. The continuation of the downward bias comes in response to further gains in the US Dollar as market participants continue to assess the mixed release of US Nonfarm Payrolls in December.

GBP/USD breaks below 1.3400, challenges the 200-day SMA

GBP/USD remains under heavy fire and retreats for the fourth consecutive day on Friday. Indeed, Cable suffers the strong performance of the Greenback, intensified post-mixed NFP, and trades at shouting distance from its critical 200-day SMA near 1.3380.

Gold flirts with yearly tops around $4,500

Gold keeps its positive bias on Friday, adding to Thursday’s advance and challenging yearly highs in the $4,500 region per troy ounce. The risk-off sentiment favours the yellow metal despite the firmer tone in the Greenback and rising US Treasury yields.

Crypto Today: Bitcoin, Ethereum, XRP risk further decline as market fear persists amid slowing demand

Bitcoin holds $90,000 but stays below the 50-day EMA as institutional demand wanes. Ethereum steadies above $3,000 but remains structurally weak due to ETF outflows. XRP ETFs resume inflows, but the price struggles to gain ground above key support.

Week ahead – US CPI might challenge the geopolitics-boosted Dollar

Geopolitics may try to steal the limelight from US data. A possible US Supreme Court ruling on tariffs could dictate market movements. A crammed data calendar next week, US CPI comes on Tuesday; Fedspeak to intensify.

XRP trades under pressure amid weak retail demand

XRP presses down on the 50-day EMA support as risk-averse sentiment spreads despite a positive start to 2026. XRP faces declining retail demand, as reflected in futures Open Interest, which has fallen to $4.15 billion.