Newmont Corporation Elliott Wave technical forecast [Video]
![Newmont Corporation Elliott Wave technical forecast [Video]](https://editorial.fxstreet.com/images/Markets/Equities/Industries/Automobiles/wheel-637322357246554724.jpg)
NEM Elliott Wave technical analysis
Greetings, Our Elliott Wave analysis today updates the Australian Stock Exchange (ASX) with NEWMONT CORPORATION - NEM. We see NEM continuing to push higher.
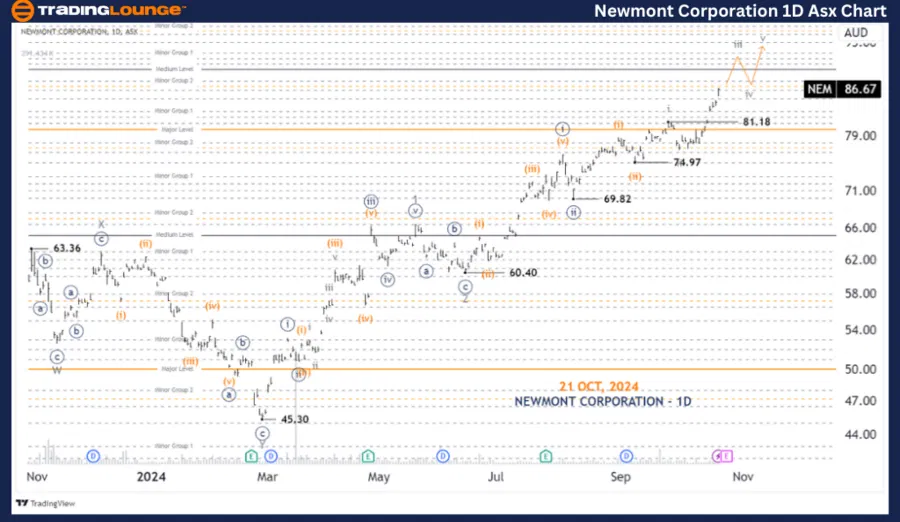
ASX: NEWMONT CORPORATION - NEM 1D Chart (Semilog Scale) Analysis
Function: Major trend (Minute degree, navy).
Mode: Motive.
Structure: Impulse.
Position: Wave iii-grey of Wave (iii)-orange of Wave ((iii))-navy of Wave 3-grey.
Details: Wave iii-grey is still unfolding to push higher, possibly towards 90.00, then wave iv-grey may come back and push a bit lower, finally wave v-grey will still come back to push higher.
Invalidation point: 81.18.
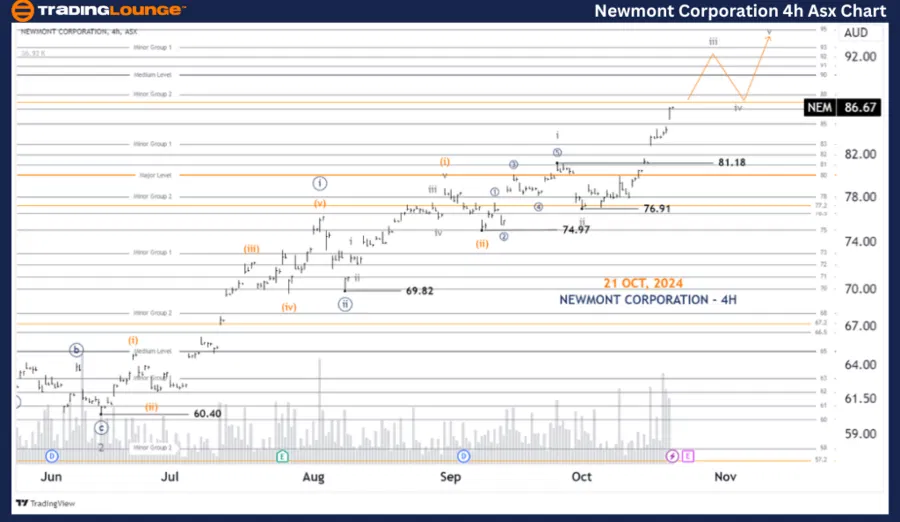
NEM four-hour chart analysis
Function: Major trend (Subminuette degree, grey).
Mode: Motive.
Structure: Impulse.
Position: Wave iii-grey of Wave (iii)-orange of Wave ((iii))-navy.
Details: Since the low at 76.91, wave iii-grey is unfolding to push higher. It could target around 90.00. After that, we will have a pullback lower with wave iv-grey. And finally, wave v-grey will continue its work to push higher.
Invalidation point: 81.18.
Conclusion
Our analysis, forecast of contextual trends, and short-term outlook for ASX: NEWMONT CORPORATION - NEM aim to provide readers with insights into the current market trends and how to capitalize on them effectively. We offer specific price points that act as validation or invalidation signals for our wave count, enhancing the confidence in our perspective. By combining these factors, we strive to offer readers the most objective and professional perspective on market trends.
Newmont Corporation Elliott Wave technical forecast [Video]
Author

Peter Mathers
TradingLounge
Peter Mathers started actively trading in 1982. He began his career at Hoei and Shoin, a Japanese futures trading company.


