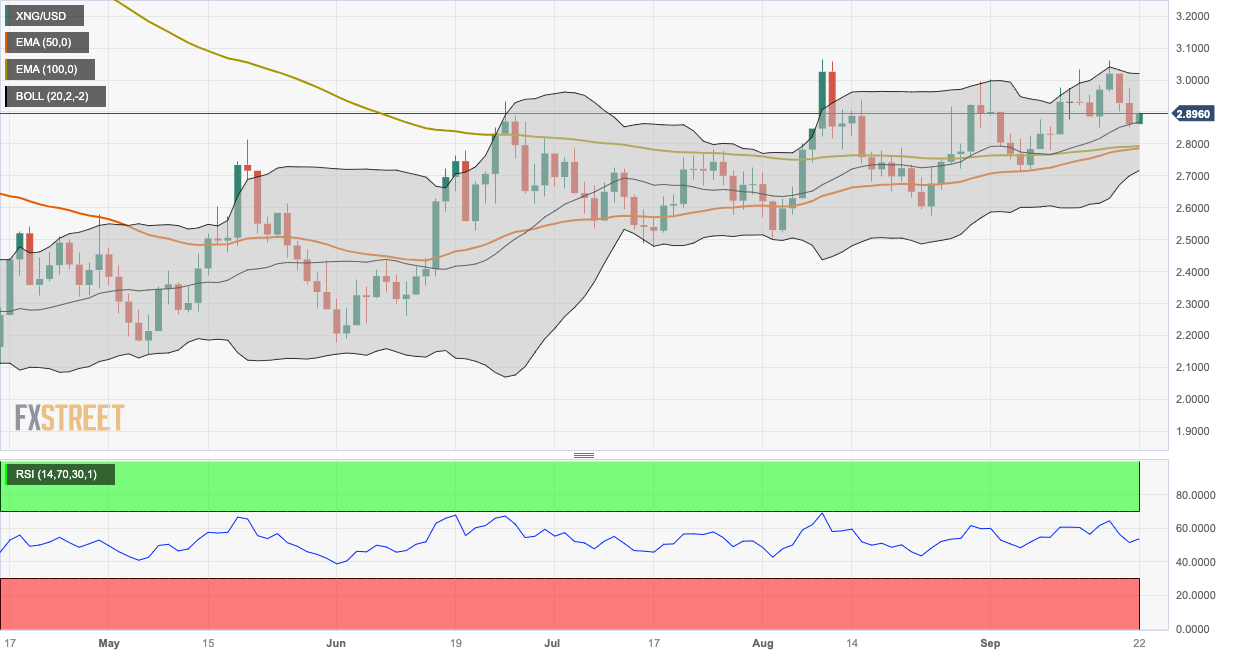
- Natural Gas price attracts some buyers and turns positive around $2.89 on Friday.
- The 50-hour EMA is on the verge of crossing above the 100-hour EMA.
- Relative Strength Index (RSI) stands in bullish territory above 50.
- The key resistance level for XNG/USD is located at $3.00; the critical support level is located at $2.78.
Natural Gas price (XNG/USD) recovers its losses during the early European trading hours on Friday. XNG/USD currently trades near $2.89 per MMBtu, gaining 1.19% for the day. The Energy Information Administration (EIA) revealed on Thursday that the weekly Natural Gas Storage Change for the week ending September 15 increased by 64B from the previous week of 67B.
From a technical perspective, Natural Gas price holds above the 50- and 100-day Exponential Moving Averages (EMAs) on the daily chart. It’s worth noting that the 50-hour EMA is on the verge of crossing above the 100-hour EMA. If a decisive crossover occurs on the daily chart, it would validate a Bull Cross, highlighting the path of least resistance for XNG/USD is to the upside. Meanwhile, the Relative Strength Index (RSI) stands in bullish territory above 50, supporting the buyers for now.
The key resistance level for natural gas is located at $3.00, representing the confluence of the upper boundary of the Bollinger Band, a psychological round mark, and a high of September 20. A break above the latter will see the next barrier at $3.08 (a high of March 3). Further north, the additional upside filter is seen around a high of January 24 at $3.30
On the flip side, the critical support level is located at $2.78. The mentioned level portrays the convergence of 50- and 100-day EMAs. The next contention level will emerge at $2.70 (the lower limit of the Bollinger Band). Any follow-through selling below the latter will see a drop to $2.50 (a low of August 2), and finally at $2.26 (a low of June 12).
XNG/USD daily chart
Information on these pages contains forward-looking statements that involve risks and uncertainties. Markets and instruments profiled on this page are for informational purposes only and should not in any way come across as a recommendation to buy or sell in these assets. You should do your own thorough research before making any investment decisions. FXStreet does not in any way guarantee that this information is free from mistakes, errors, or material misstatements. It also does not guarantee that this information is of a timely nature. Investing in Open Markets involves a great deal of risk, including the loss of all or a portion of your investment, as well as emotional distress. All risks, losses and costs associated with investing, including total loss of principal, are your responsibility. The views and opinions expressed in this article are those of the authors and do not necessarily reflect the official policy or position of FXStreet nor its advertisers. The author will not be held responsible for information that is found at the end of links posted on this page.
If not otherwise explicitly mentioned in the body of the article, at the time of writing, the author has no position in any stock mentioned in this article and no business relationship with any company mentioned. The author has not received compensation for writing this article, other than from FXStreet.
FXStreet and the author do not provide personalized recommendations. The author makes no representations as to the accuracy, completeness, or suitability of this information. FXStreet and the author will not be liable for any errors, omissions or any losses, injuries or damages arising from this information and its display or use. Errors and omissions excepted.
The author and FXStreet are not registered investment advisors and nothing in this article is intended to be investment advice.
Recommended content
Editors’ Picks
EUR/USD hits multi-day lows below 1.0900 after US data

The US Dollar strengthened following the release of US Core PCE and Jobless Claims data. EUR/USD reached four-day lows below 1.0900 and remains under pressure. The DXY rose above 103.50, extending the recovery from monthly lows boosted by higher Treasury yields.
GBP/USD extends slide towards 1.2600 as Dollar strengthens

GBP/USD slid towards the 1.2600 region, retreating almost a hundred pips from daily highs. The pair weakened further after the release of US consumer inflation and Jobless Claims data. The US Dollar gained momentum boosted by higher Treasury yields.
Gold price steady at around $2,040 after US PCE figures

Gold price (XAU/USD) struggles to gain any meaningful traction on Thursday and consolidates its recent strong gains to its highest level since May 5 touched the previous day. US Dollar gaining modest traction on encouraging inflation gauges.
Bitcoin Spot ETF anticipation fuels BTC price rally in spot and futures markets

Bitcoin Spot ETFs could see a batch approval in January. Eric Balchunas, a Bloomberg ETF analyst shared details of an updated application by asset manager BlackRock.
Oil up half it was earlier this Wednesday as OPEC+ Joint Ministerial Committee takes place

WTI Oil clings on to 1% gains as OPEC+ meeting enters next phase. The US Dollar is roaring back after a few days of substantial weakness. Oil very volatile ahead of a possible OPEC+ outcome later this Thursday.