Natural Gas rips lower by 1% after bigger EIA gas storage buildup
- Natural Gas prices are falling back below $1.90.
- Traders are focusing on the robust Gas reserves in Europe ahead of the next heating season.
- The US Dollar Index fell to the lower 103.00 level after the Fed meeting.

Natural Gas prices (XNG/USD) trade subdued on Thursday after facing some profit-taking on Wednesday, with traders locking in some gains on long positions taken in the past few weeks. With the mixture of recent supply issues and delays in deliveries, European Gas reserves are not seeing the quick drain expected, urging traders to at least book some profit now. Meanwhile, LNG as an energy commodity is facing some pressure from European leaders, who are pushing for a renaissance in nuclear energy.
Meanwhile, the US Dollar (USD) fell back below 104.00 and nearly all the way back to 103.00. The US Federal Reserve (Fed) was the main driver of the move by confirming via its dot plot that it still sees three rate cuts happening this year. This meant markets had to reprice their US Dollar positions again after investors had already dialed down their optimism to only two rate cuts for this year.
Natural Gas is trading at $1.83 per MMBtu at the time of writing.
Natural Gas news and market movers: Gas reserves an issue
- Lower emission levels and energy security is pushing European Leaders to revisit their commitment of shunning away from nuclear energy.
- The UK is facing supply issues, with no LNG arrivals since March 9, and the next delivery only scheduled for March 24, according to ship-tracking data from Bloomberg.
- Norwegian Gas outflows into Europe are picking up in volume again after some unforeseen disruptions and maintenance.
- Oil company Petrobras (state-controlled by Brazil) is turning to liquefied Natural Gas imports this month to secure supplies while it carries out maintenance work at a major offshore pipeline.
- The Energy Information Administration has released its weekly Gas Storage changes . Previous number was a contraction of 9 billion cubic feet, with a rise by 7 billion cubic feet for this weeks number.
Natural Gas Technical Analysis: Gas Storage numbers adds to profit taking
Natural Gas prices are consolidating with a pennant formation on the Daily Chart, formed by lower highs and higher lows since mid-February. With both buyers and sellers being pushed toward each other, a breakout could be due at any time. Seeing the current lackluster energy demand out of Europe, with its storage units still above average, a turn to the downside looks more likely than an upside breakout.
On the upside, the key $2.00 level needs to be regained first. The next key mark is the historic pivotal point at $2.12, which falls broadly in line with the 55-day Simple Moving Average (SMA) at $2.05. Should Gas prices pop up in that region, a broad area opens up with the first cap at the red descending trendline near $2.27.
On the downside, multi-year lows are still nearby with $1.65 as the first line in the sand. This year’s low at $1.60 needs to be kept an eye on as well. Once a new low for the year is printed, traders should look at $1.53 as the next supportive area.
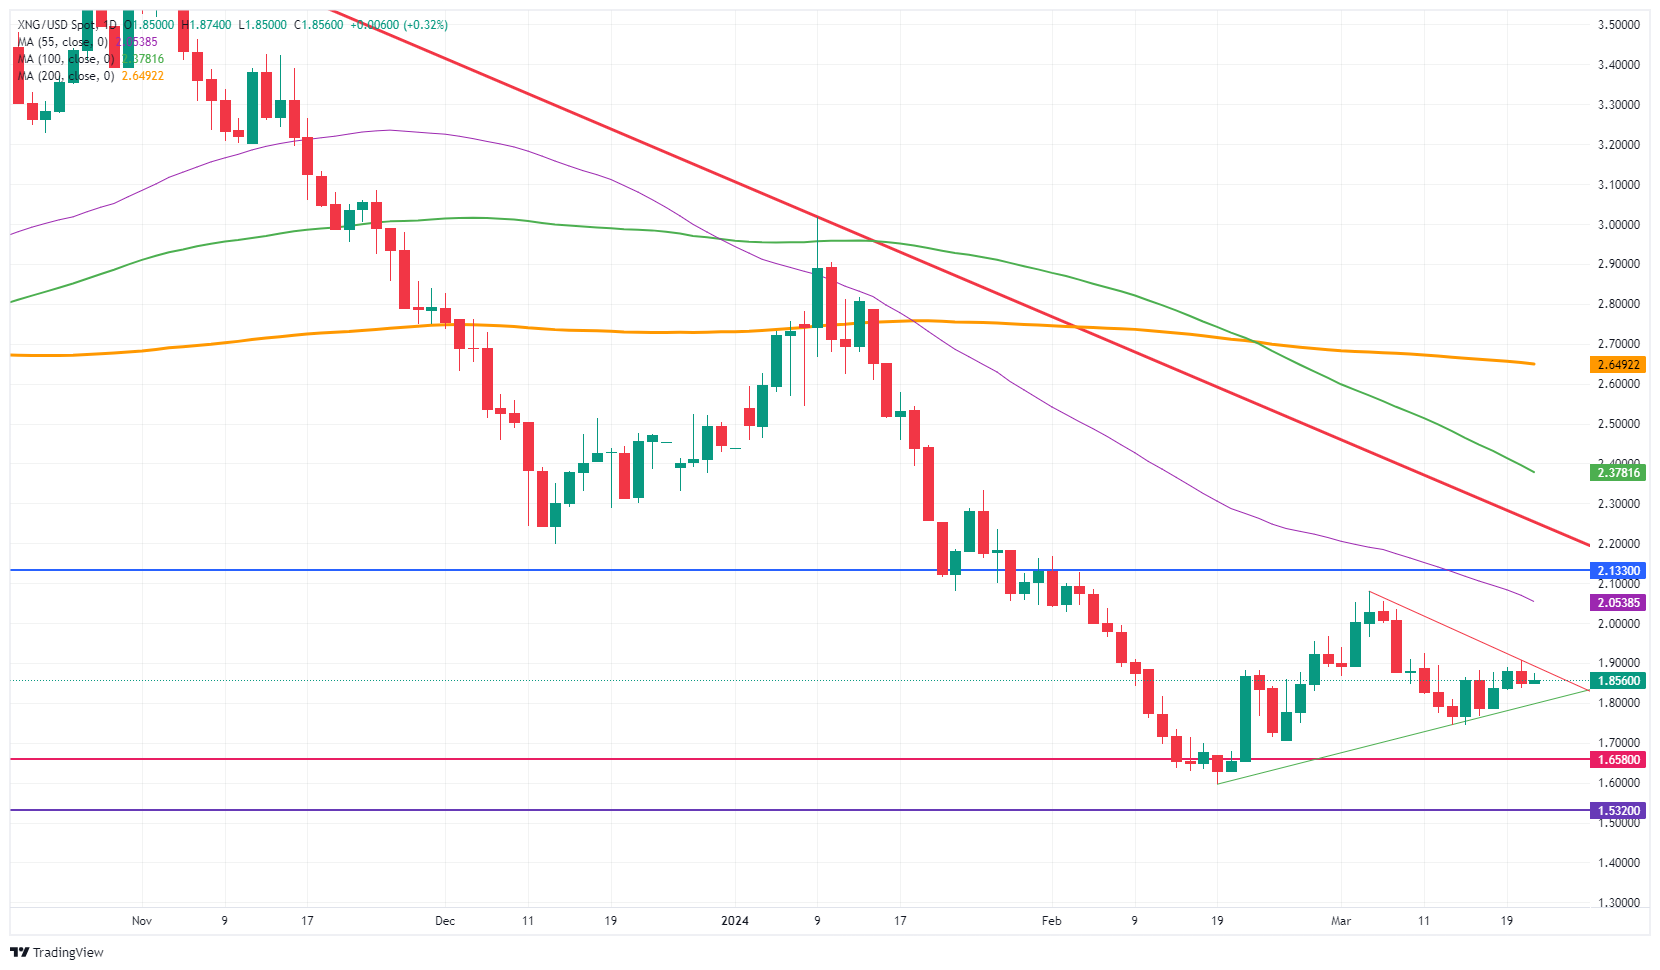
Natural Gas: Daily Chart
Natural Gas FAQs
Supply and demand dynamics are a key factor influencing Natural Gas prices, and are themselves influenced by global economic growth, industrial activity, population growth, production levels, and inventories. The weather impacts Natural Gas prices because more Gas is used during cold winters and hot summers for heating and cooling. Competition from other energy sources impacts prices as consumers may switch to cheaper sources. Geopolitical events are factors as exemplified by the war in Ukraine. Government policies relating to extraction, transportation, and environmental issues also impact prices.
The main economic release influencing Natural Gas prices is the weekly inventory bulletin from the Energy Information Administration (EIA), a US government agency that produces US gas market data. The EIA Gas bulletin usually comes out on Thursday at 14:30 GMT, a day after the EIA publishes its weekly Oil bulletin. Economic data from large consumers of Natural Gas can impact supply and demand, the largest of which include China, Germany and Japan. Natural Gas is primarily priced and traded in US Dollars, thus economic releases impacting the US Dollar are also factors.
The US Dollar is the world’s reserve currency and most commodities, including Natural Gas are priced and traded on international markets in US Dollars. As such, the value of the US Dollar is a factor in the price of Natural Gas, because if the Dollar strengthens it means less Dollars are required to buy the same volume of Gas (the price falls), and vice versa if USD strengthens.
Author

Filip Lagaart
FXStreet
Filip Lagaart is a former sales/trader with over 15 years of financial markets expertise under its belt.


