Natural Gas keeps stretching higher in fierce rally
- Natural Gas prices are up over 2.5% on the day.
- China’s biggest LNG buyers placed orders to further expand its LNG tanker fleet.
- The US Dollar Index sinks after US CPI shows the economy is back on track in its disinflationary path.

Natural Gas price (XNG/USD) is unchained and prints again near 2.6% gains on Thursday, reaching the highest level in four months and breaking another important technical level on more headlines that China is cornering the Gas markets. China National Offshore Oil Corporation has placed an order for 12 ships worth 16 billion($2.2 billion) for Liquified Natural Gas (LNG) tankers. This adds to news that several trading hubs such as London have confirmed that more Chinese participants are buying up contracts at local European and US Gas markets.
The US Dollar Index (DXY), which tracks the Greenback’s value against six major currencies, is trading substantially lower after recent Consumer Price Index (CPI) data revealed that the US inflation resumed its decline. Although markets were quick to price in again two rate cuts for 2024, all US Federal Reserve officials and even Fed Chairman Jerome Powell are very vocal in pushing back on those bets by saying that rates might be staying longer at current levels. The trading conditions for the Greenback have changed and could now see further easing (or selling)with every economic data point undershooting market expectations.
Natural Gas is trading at $2.65 per MMBtu at the time of writing.
Natural Gas news and market movers: Ahead EIA
- While US Gas prices are going through the roof, European Gas markets are rather trading steadily in a tight range with sluggish demand in play with Europe still carrying robust stocks into its refueling season.
- For nearly four months, no LNG carrier has passed through the Red Sea ever since the Houthi rebel attacks started to take place, Bloomberg reports.
- Since the pandemic, China is back on top of the leaderboard in importing LNG, measuring around 71.3 million tons last year.
- Continuing disruptions in the Red Sea are forcing LNG vessels to reroute around Africa to transport fuel between the Atlantic and Pacific ports. As a consequence, Asian buyers only have a limited pool of suppliers available to buy LNG from unless they’re willing to pay for higher shipping costs.
- Around 14:30 GMT, the weekly storage change from the Enery Information Administration will be released for Natural Gas. Previous number was at 79 billion cubic feet, with a draw down expected to 76 billion cubic feet for this week.
Natural Gas Technical Analysis: Smashing it out of the park
Natural Gas is rising sharply, even taking out the very important 200-day Simple Moving Average (SMA) around $2.53. This brings XNG/USD spot price in a whole other ballpark, where $3.07 looks to be the first upside big profit target at hand. This would mean another 18% gains on the table, should the US Dollar continue to weaken and China keeps propelling demand.
The $3.00 marker as a big figure is the first level to watch on the upside. Once through there, the pivotal level near $3.07 (high of March 6, 2023) will come into play and mark a new high for 2024. Further up, there is room for a quick crossing towards $3.69.
On the downside, ahead of the double belt with the 100-day SMA at $2.09 and the pivotal level at $2.11 (low of April 14, 2023), the 200-day SMA now should act as support near $2.53. Should both support areas fail to hold, then the ascending green trendline near $1.98, together with the 55-day SMA at $2.00, should avoid a further decline.
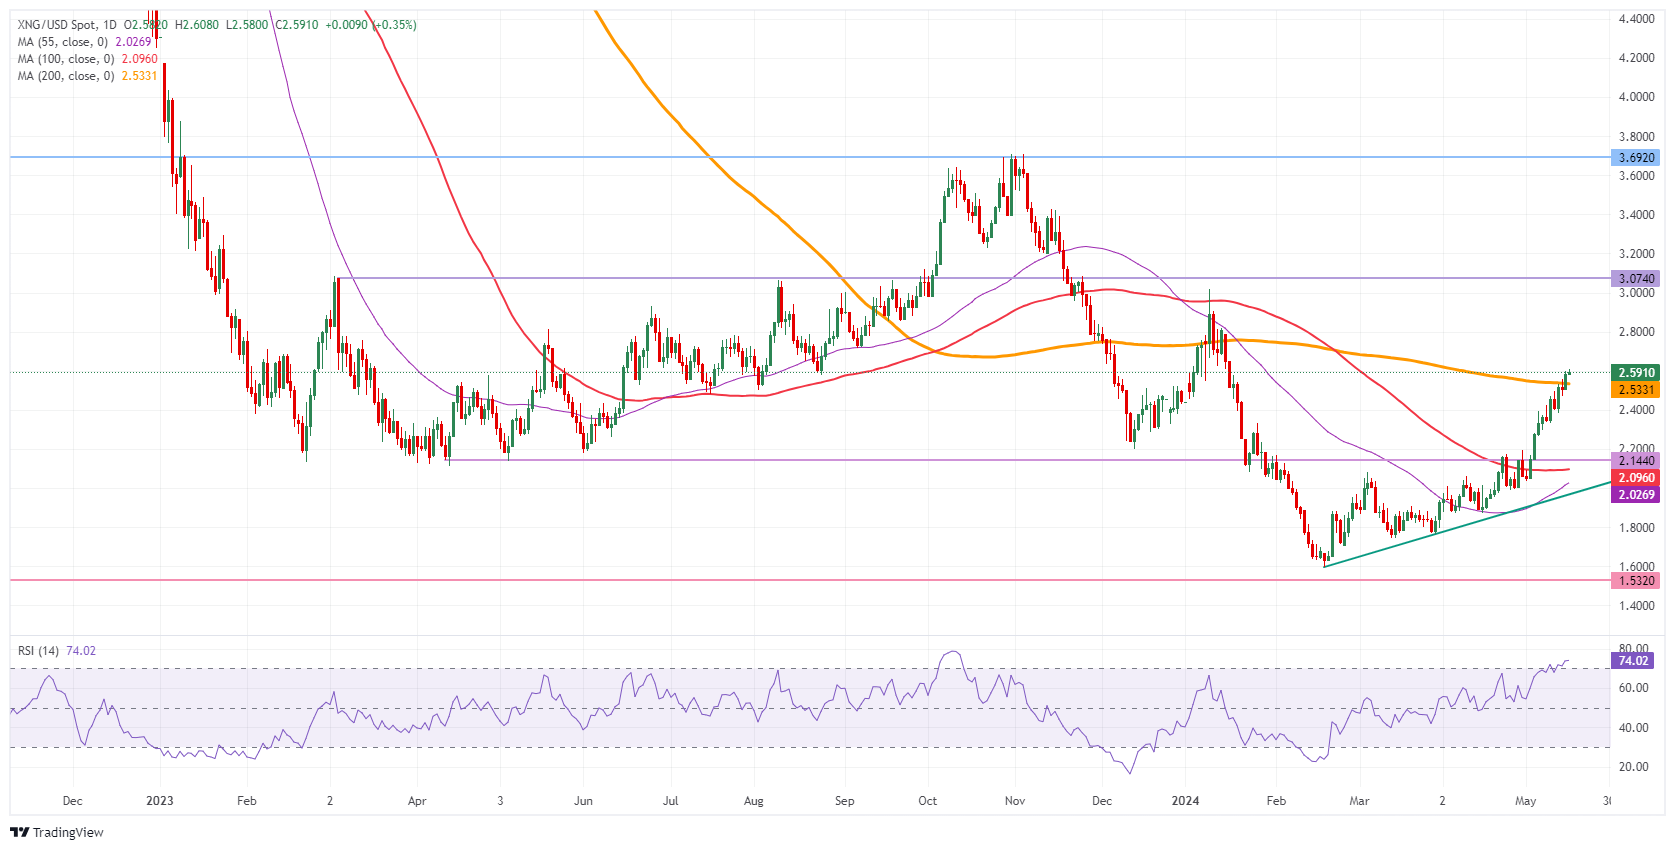
Natural Gas: Daily Chart
Natural Gas FAQs
Supply and demand dynamics are a key factor influencing Natural Gas prices, and are themselves influenced by global economic growth, industrial activity, population growth, production levels, and inventories. The weather impacts Natural Gas prices because more Gas is used during cold winters and hot summers for heating and cooling. Competition from other energy sources impacts prices as consumers may switch to cheaper sources. Geopolitical events are factors as exemplified by the war in Ukraine. Government policies relating to extraction, transportation, and environmental issues also impact prices.
The main economic release influencing Natural Gas prices is the weekly inventory bulletin from the Energy Information Administration (EIA), a US government agency that produces US gas market data. The EIA Gas bulletin usually comes out on Thursday at 14:30 GMT, a day after the EIA publishes its weekly Oil bulletin. Economic data from large consumers of Natural Gas can impact supply and demand, the largest of which include China, Germany and Japan. Natural Gas is primarily priced and traded in US Dollars, thus economic releases impacting the US Dollar are also factors.
The US Dollar is the world’s reserve currency and most commodities, including Natural Gas are priced and traded on international markets in US Dollars. As such, the value of the US Dollar is a factor in the price of Natural Gas, because if the Dollar strengthens it means less Dollars are required to buy the same volume of Gas (the price falls), and vice versa if USD strengthens.
Author

Filip Lagaart
FXStreet
Filip Lagaart is a former sales/trader with over 15 years of financial markets expertise under its belt.


