NASDAQ100: Lower first, followed by new all-time highs!?

For those new to our Elliott Wave-based analyses and as a reminder to our regular readers, we have been tracking an ending diagonal (ED) pattern for the NASDAQ100 (NDX) for over a month. In our previous update, we found that
“the index has advanced to the minimal upside target [123.60% @ NDX21509] for the third wave extension within an ending diagonal pattern. However, while the downside risk is thus currently increasing and appropriate actions should be taken, e.g., raise stops and take partial profits, until we see at least a break below NDX21200, we can still allow for higher prices … the red 138.20% extension at NDX21868… A break below that level, especially the (orang) 3rd warning level at NDX20600, will tell us that the red W-iv to ideally NDX20000-20300 is underway.”
Fast-forward: After our update, the index didn’t break below NDX21200 but continued to NDX22133 by December 16, thus slightly exceeding the $21868 level. However, FED-Wednesday, December 18th, erased the prior ten days of gains. Following the continued rally, we had already raised the warning levels for our Premium Members to NDX21600, and thus, no harm was done.
The index bottomed on December 20 at NDX20913 and has rallied to the ideal green W-b target zone, from which it was rejected today. See Figure 1 below
Figure 1. NDX daily chart with detailed Elliott Wave count and technical indicators
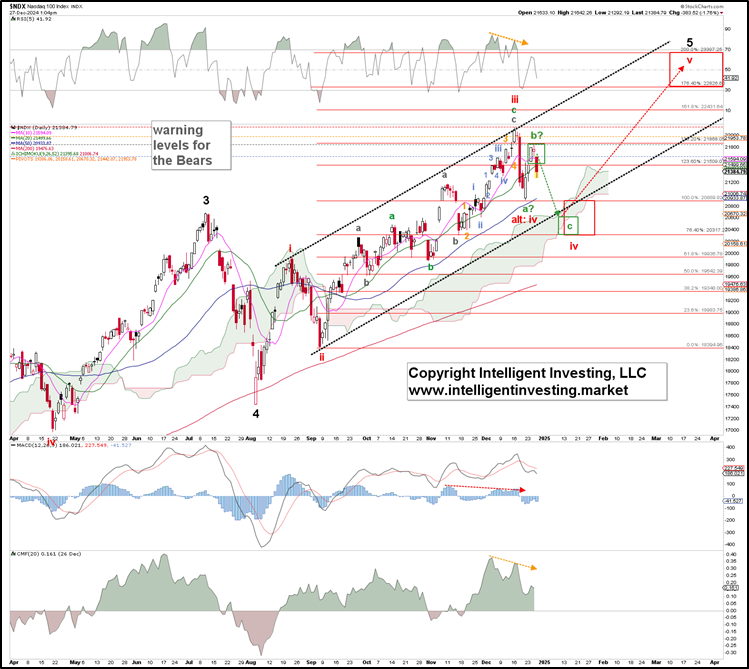
Thus, the anticipated red W-iii top came and went, and the index should now be in the red W-iv. Given it topped precisely in the ideal bounce (green W-b) target zone, we expect it to reach NDX20300-600 for the green W-c of the red W-iv, as shown. Note that these levels align with what we already anticipated in late November, showing the forecasting power one can enjoy using the EW.
Thus, contingent on holding at least below yesterday’s high at NDX21837, and especially below the recent all-time high at NDX22133, we should expect the index to bottom around the NDX20300-600 level for the red W-iv before it can stage the next more significant, red W-v rally, to ideally NDX22825-23400.
Author

Dr. Arnout Ter Schure
Intelligent Investing, LLC
After having worked for over ten years within the field of energy and the environment, Dr.