Nasdaq futures test upper structure as key pivots hold

Daily and intraday structure remain aligned following the December 19 pivot reclaim
Nasdaq March Futures (NQH) - Asia, London and New York
Market context
This update is a direct continuation of the desk work published on December 19, using the same daily and intraday charts and reference levels mapped ahead of the move. The objective remains unchanged: to document how price behaves around predefined structure as the rotation develops, rather than anticipate outcomes.
Daily structure
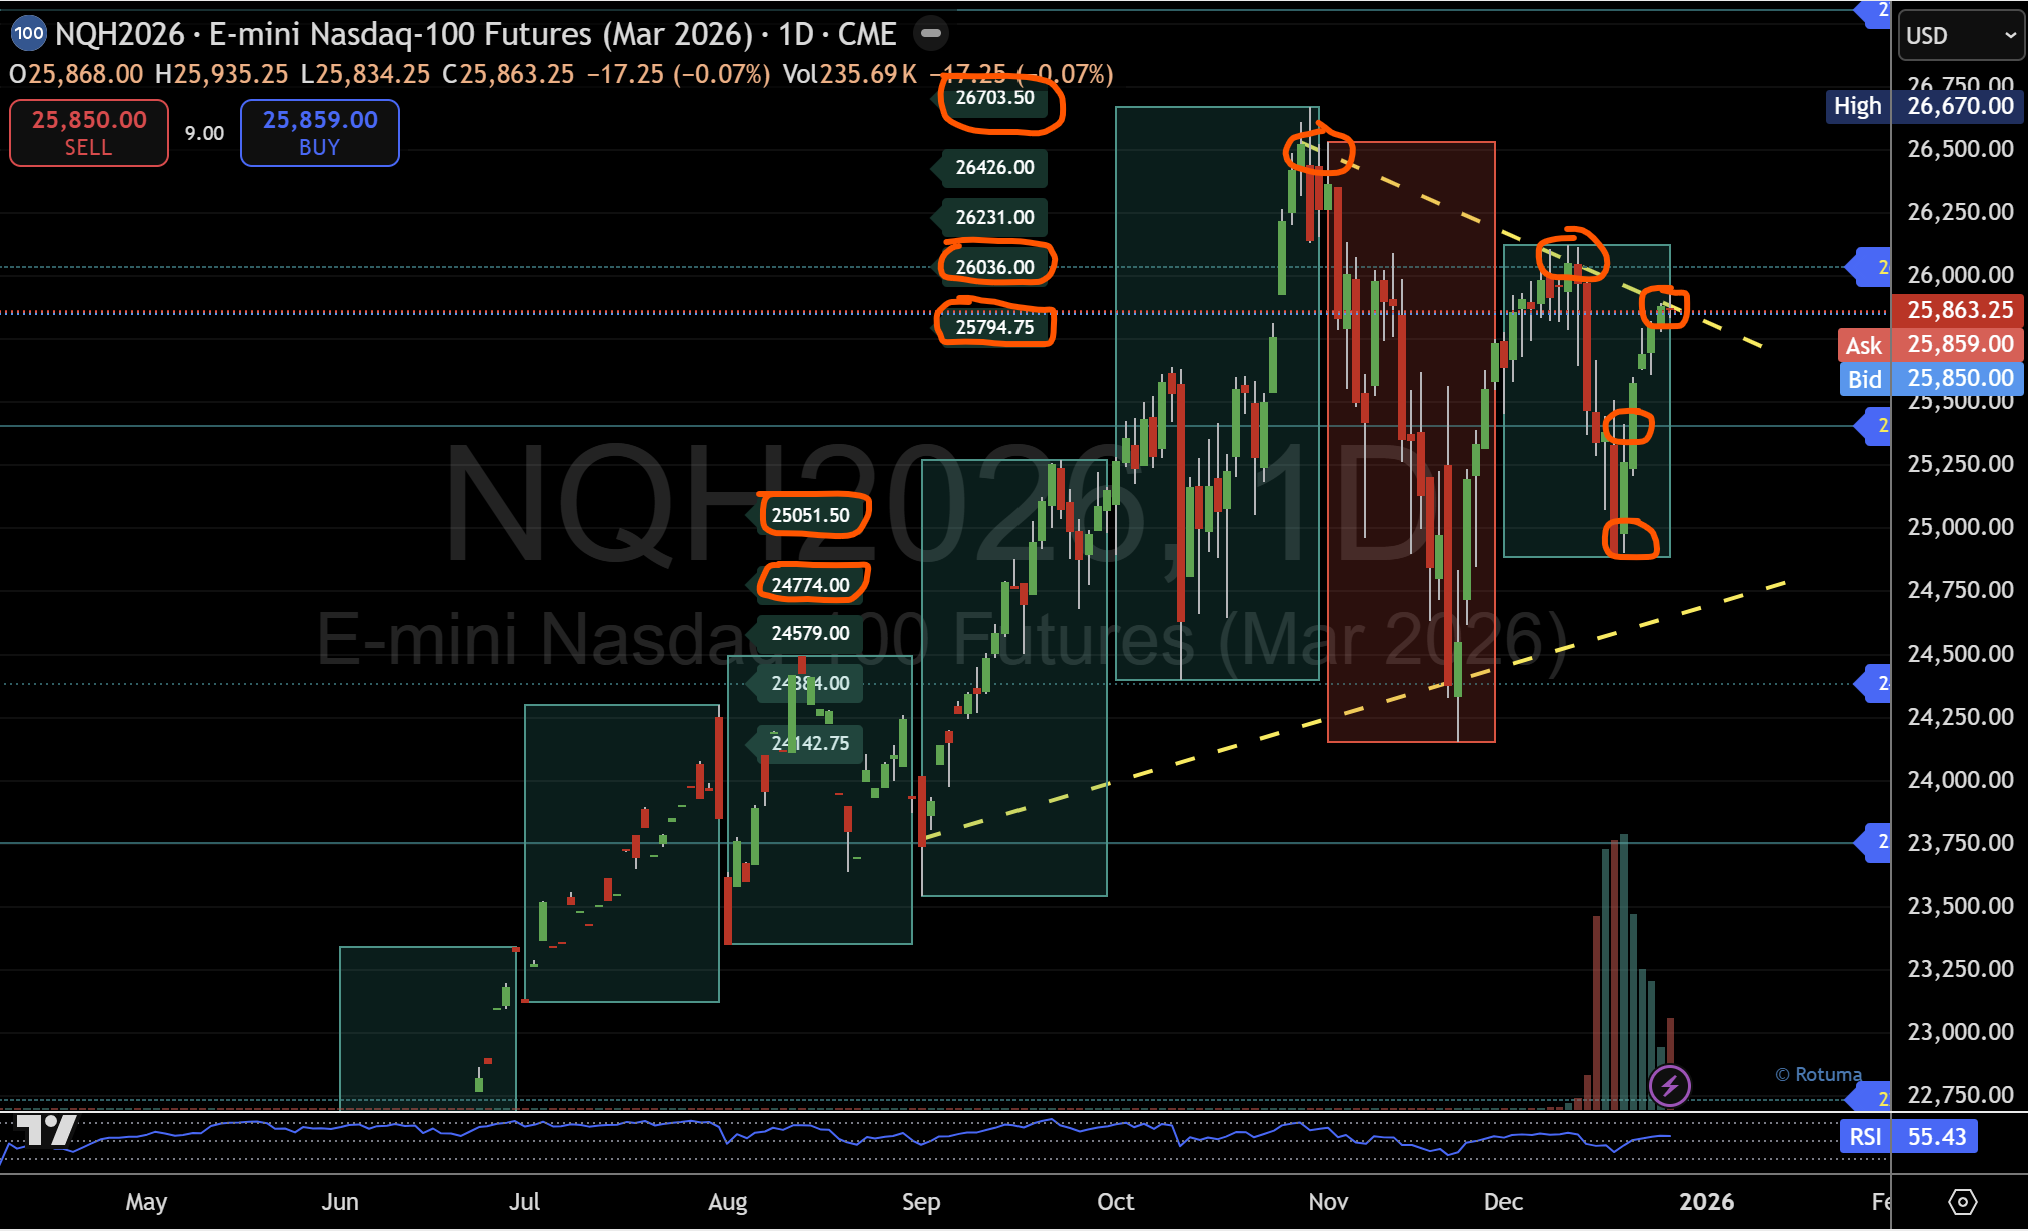
Nasdaq March futures closed the Christmas week above micro 1 at 25,794, marking a key development on the daily timeframe following the reclaim of the 25,405 central pivot on December 19, as outlined in the prior desk update.

From a structural perspective, the market has now rotated from the lower structure into the upper half of the range, covering more than 300 points from the initial rebound. While technically meaningful, the rotation remains incomplete.
The descending resistance band and micro 2 at 26,036 continue to cap price. This zone has already introduced hesitation and remains the primary obstacle before acceptance into the upper structure can be confirmed.
At this stage, the market is no longer testing recovery — it is testing continuation within structure.
Key daily references
- 25,794 (Micro 1):
First-line daily support. Holding above this level keeps the current rotation intact. - 26,036 (Micro 2):
Major resistance. Sustained acceptance above this level would complete the rotation into the upper structure. - 25,405 (Central Pivot):
A loss of 25,794 would reopen this level as the next downside reference without altering the broader framework.
The daily structure remains unchanged and continues to guide price behaviour cleanly. This framework is best suited for higher-timeframe positioning and weekly swing context, while intraday participation is framed by acceptance and rejection around the same reference points.
Intraday structure — 15 minute
On the 15-minute chart, the rotation higher from micro 4 at 24,924, established late in the previous week, continued to hold through the holiday period. This move successfully reclaimed and held the central intraday pivot at 25,514, keeping intraday structure aligned with the broader daily framework.
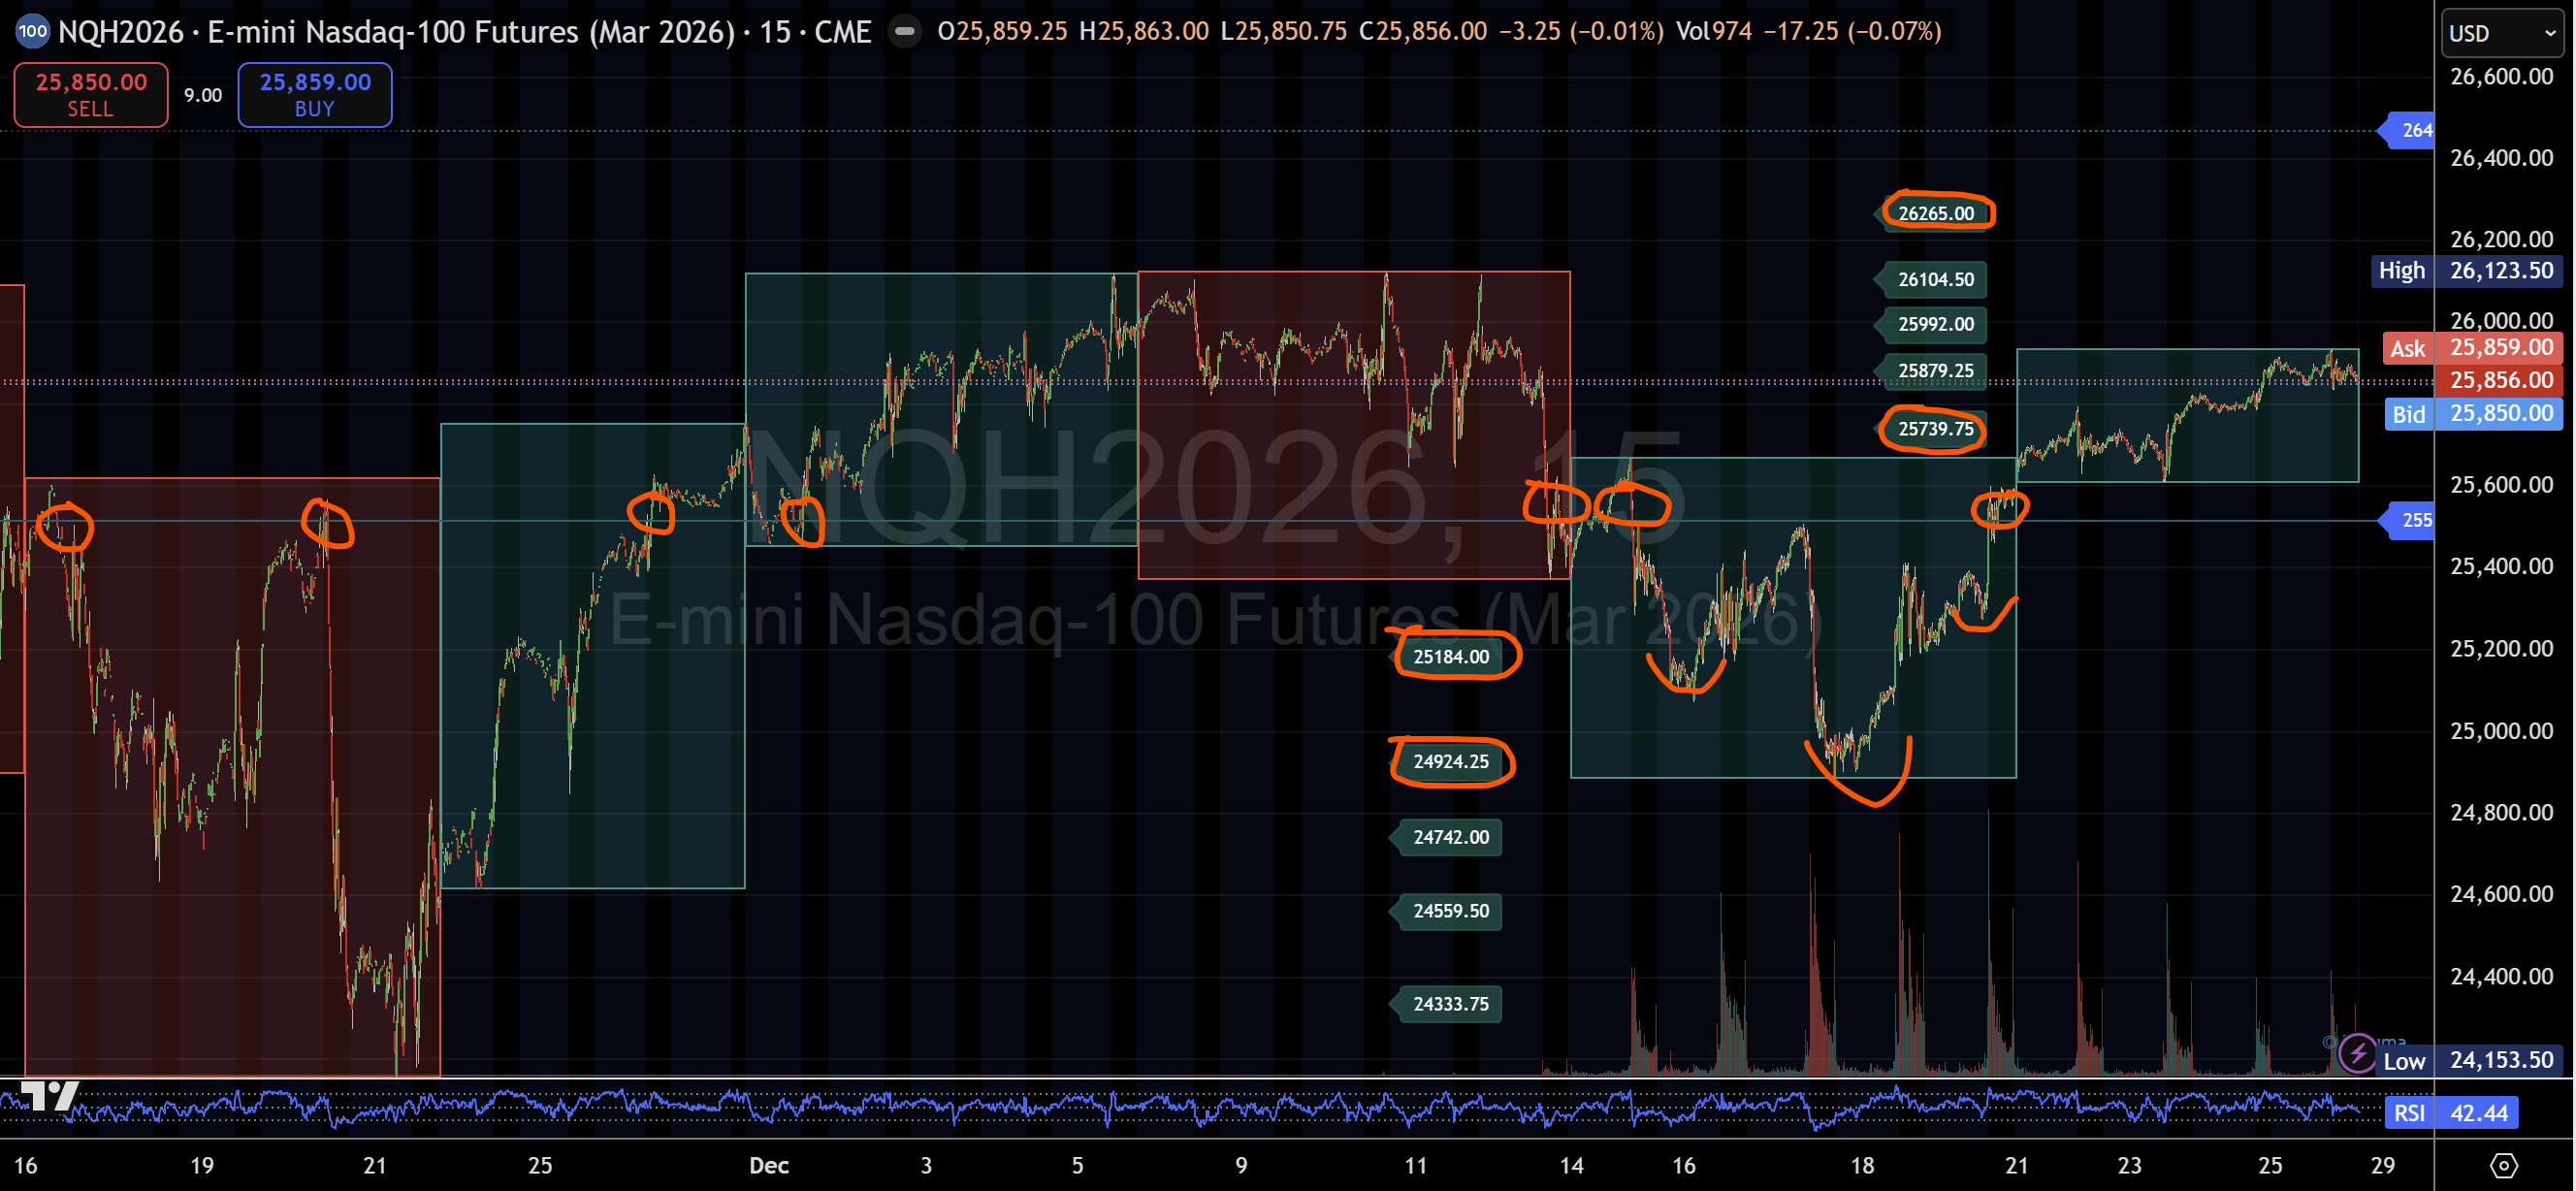
Throughout the week, micro 1 at 25,739 acted as working support, reinforcing the progression to the upside. Intraday price behaviour continues to mirror the daily structure, with acceptance developing above the central pivot rather than momentum-driven extension.
While the rotation into the upper intraday structure has progressed, it remains incomplete, with price still operating within a defined two-way environment.
Key intraday references
- 25,514 (Central Pivot):
Primary decision point. Sustained trade above this level keeps intraday structure aligned with the daily framework. - 25,739–25,879 (Micro 1–2):
Immediate upside reference zone. Acceptance above micro 2 would open the path toward a full rotation. - 25,992–26,265 (Micro 3–5):
Upper structure references that come into focus only after sustained acceptance above micro 2.
On the downside, failure to hold above 25,514 would shift attention back toward the lower structure, bringing micro 5–4 at 25,184 and 24,924 back into play, without invalidating the broader daily structure.
As the market transitions into the upcoming sessions, intraday price behaviour continues to respect predefined structural levels, reinforcing a structure-led environment.
This desk update is intended to document how price is interacting with structure as the rotation develops, helping frame risk into the next session rather than anticipating outcomes.
Structure defines the battlefield before price arrives. Levels exist ahead of time; price interaction around those levels provides the information. This desk documents behaviour and acceptance across timeframes, focusing on responses rather than reactions and on context rather than prediction.
Author

Denis Joeli Fatiaki
Independent Analyst
Denis Joeli Fatiaki possesses over a decade of extensive experience as a multi-asset trader and Market Strategist.