Nasdaq Futures hold the line at 23,748 as dip buyers defend the trend

Reclaim of micro-5 (23,857) capped the bounce; the daily pivot at 23,748 is the inflexion point—either a drive to 24,052 or a slide toward 23,680–23,593.
Overview
Nasdaq September futures opened the week with a clean test of the 23,748 daily pivot and finished the New York session still above it. Friday's selloff, driven by weak jobs data, drew in buyers again. The last three sessions show the same pattern: selloffs into support, sharp inventory rebuilds, and pushes back into the channel.
Intraday structure (5-min)
- The market held micro-1 at 23,733 into the U.S. open.
- Buy programs showed up around micro-2 at 23,766, driving a fast tag of micro-5 at 23,857 within the first half hour—textbook "buy 1–2, sell 5–4" behaviour.
- Price then faded from micro-5, as it often does, back toward the mid-channel.
- The rising dashed trendline from Friday's low continues to act as intraday demand; the next checks on that line align with 23,680 and 23,593.
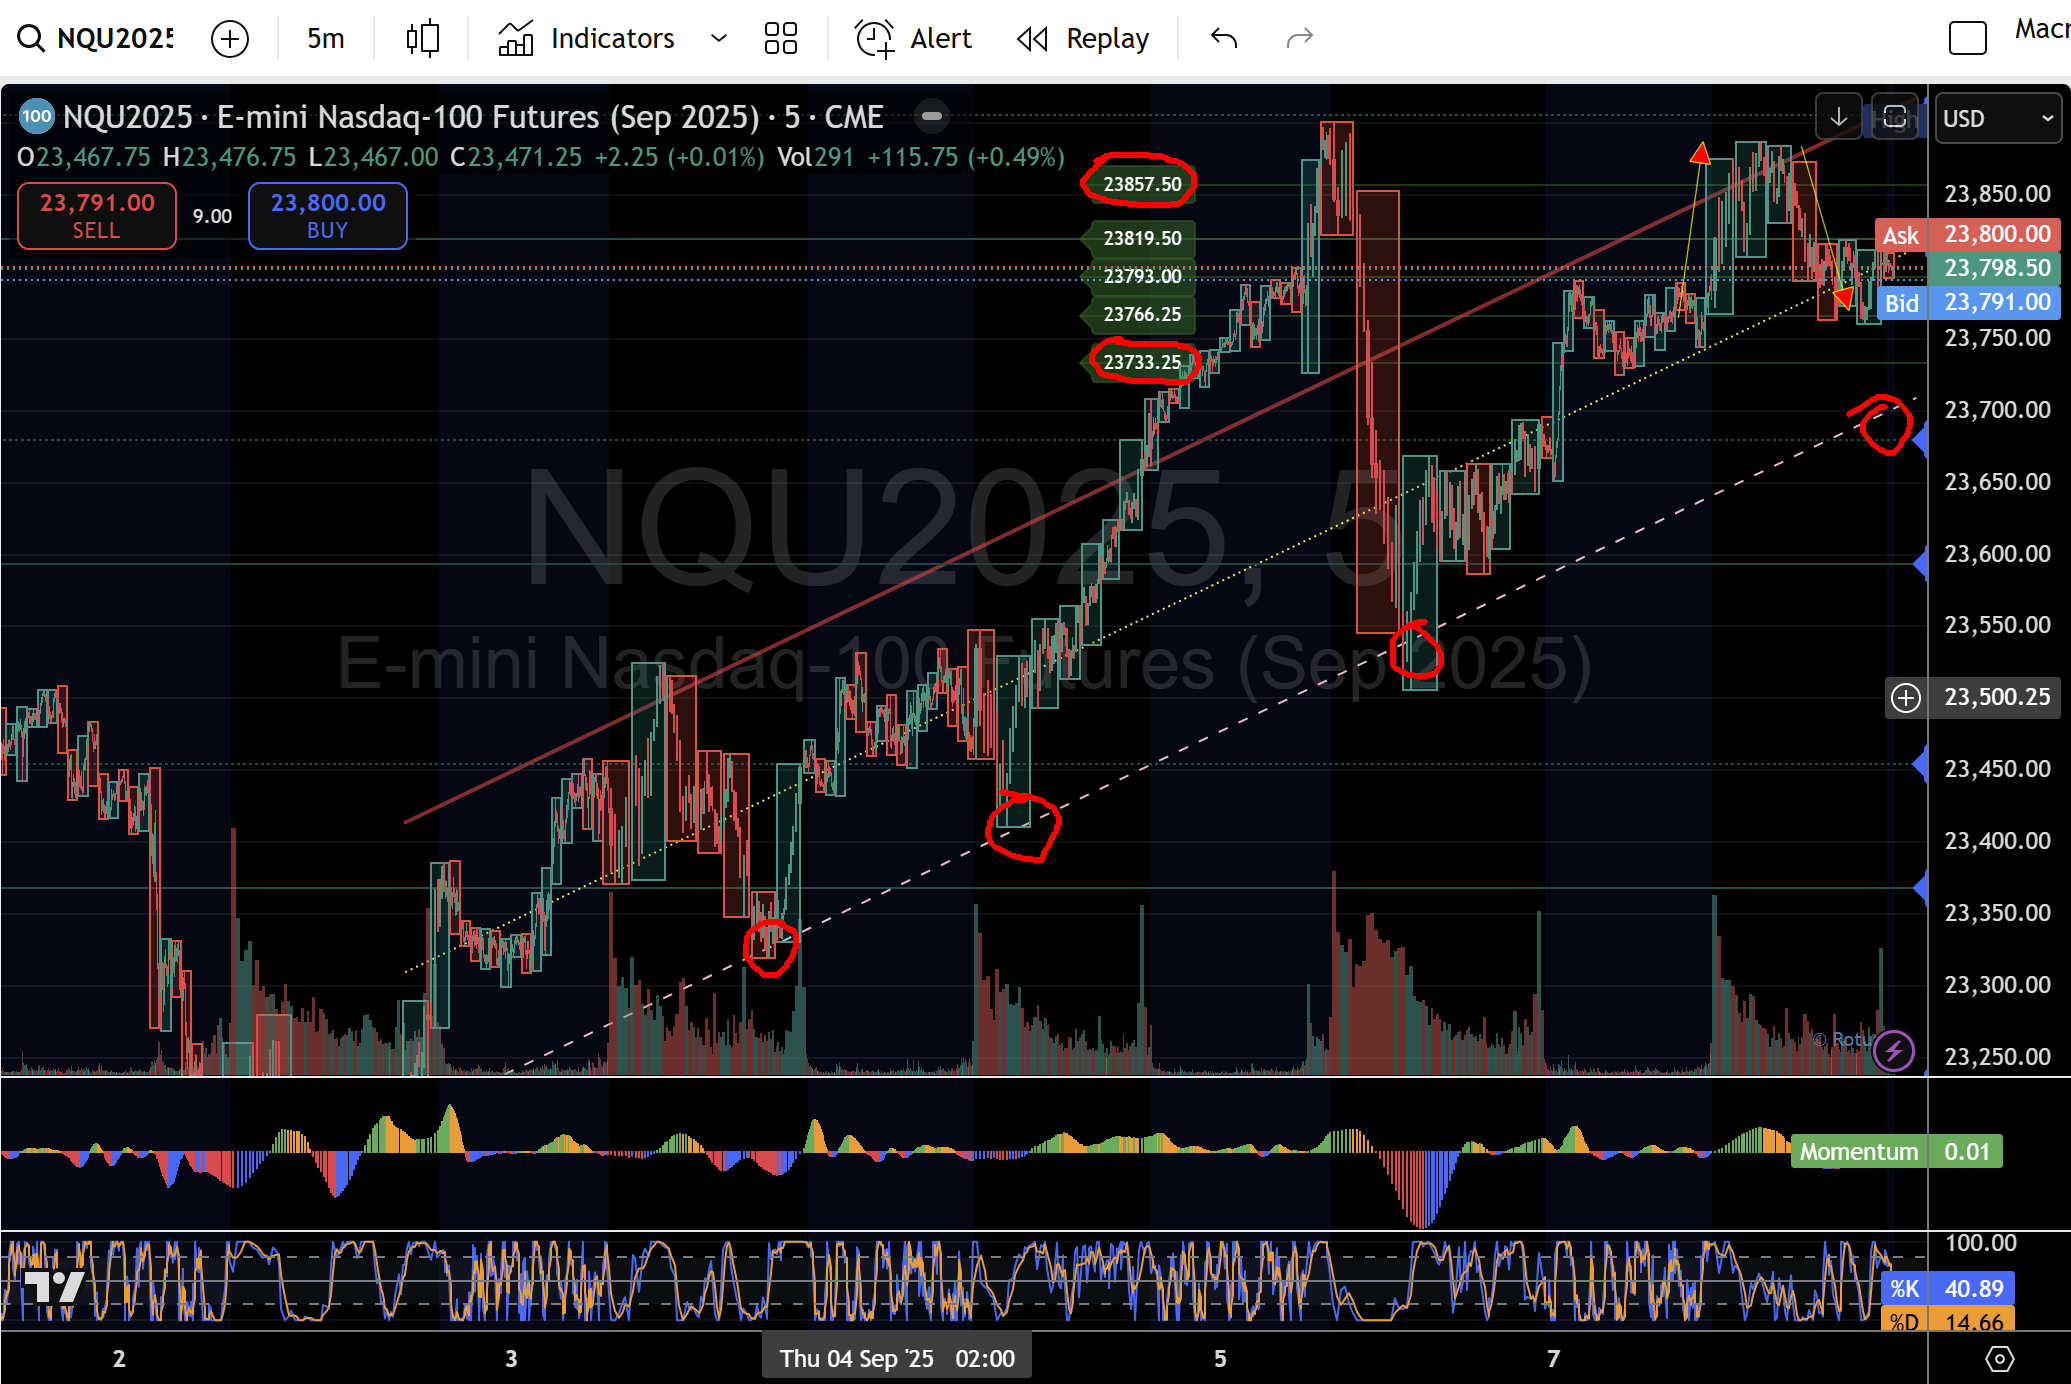
Nasdaq Futures Intraday chart 8 September
Volume/auction read
- The day's balance formed just above the daily pivot, showing acceptance rather than rejection.
- The POC clustered in the 23,770–23,780 zone, which aligns with micro-2 and the midline of the session channel—a good "fight zone" to judge control in the next session.
- No excess at the top: the tap of 23,857 was met, not chased. That leaves a measured upside objective still open if buyers can recapture and hold over 23,819–23,857.
Daily map
- Holding 23,748 keeps the 24,052 retest in play.
- Lose 23,748 decisively, and the path runs to 23,680 → 23,593 → 23,454 → 23,368 → 23,228 (laddered demand shown on the chart).
- Momentum on the dashboard sits near flat; the market is range-resolving, not trending, so execution at the pre-defined micro levels continues to outperform chasing.
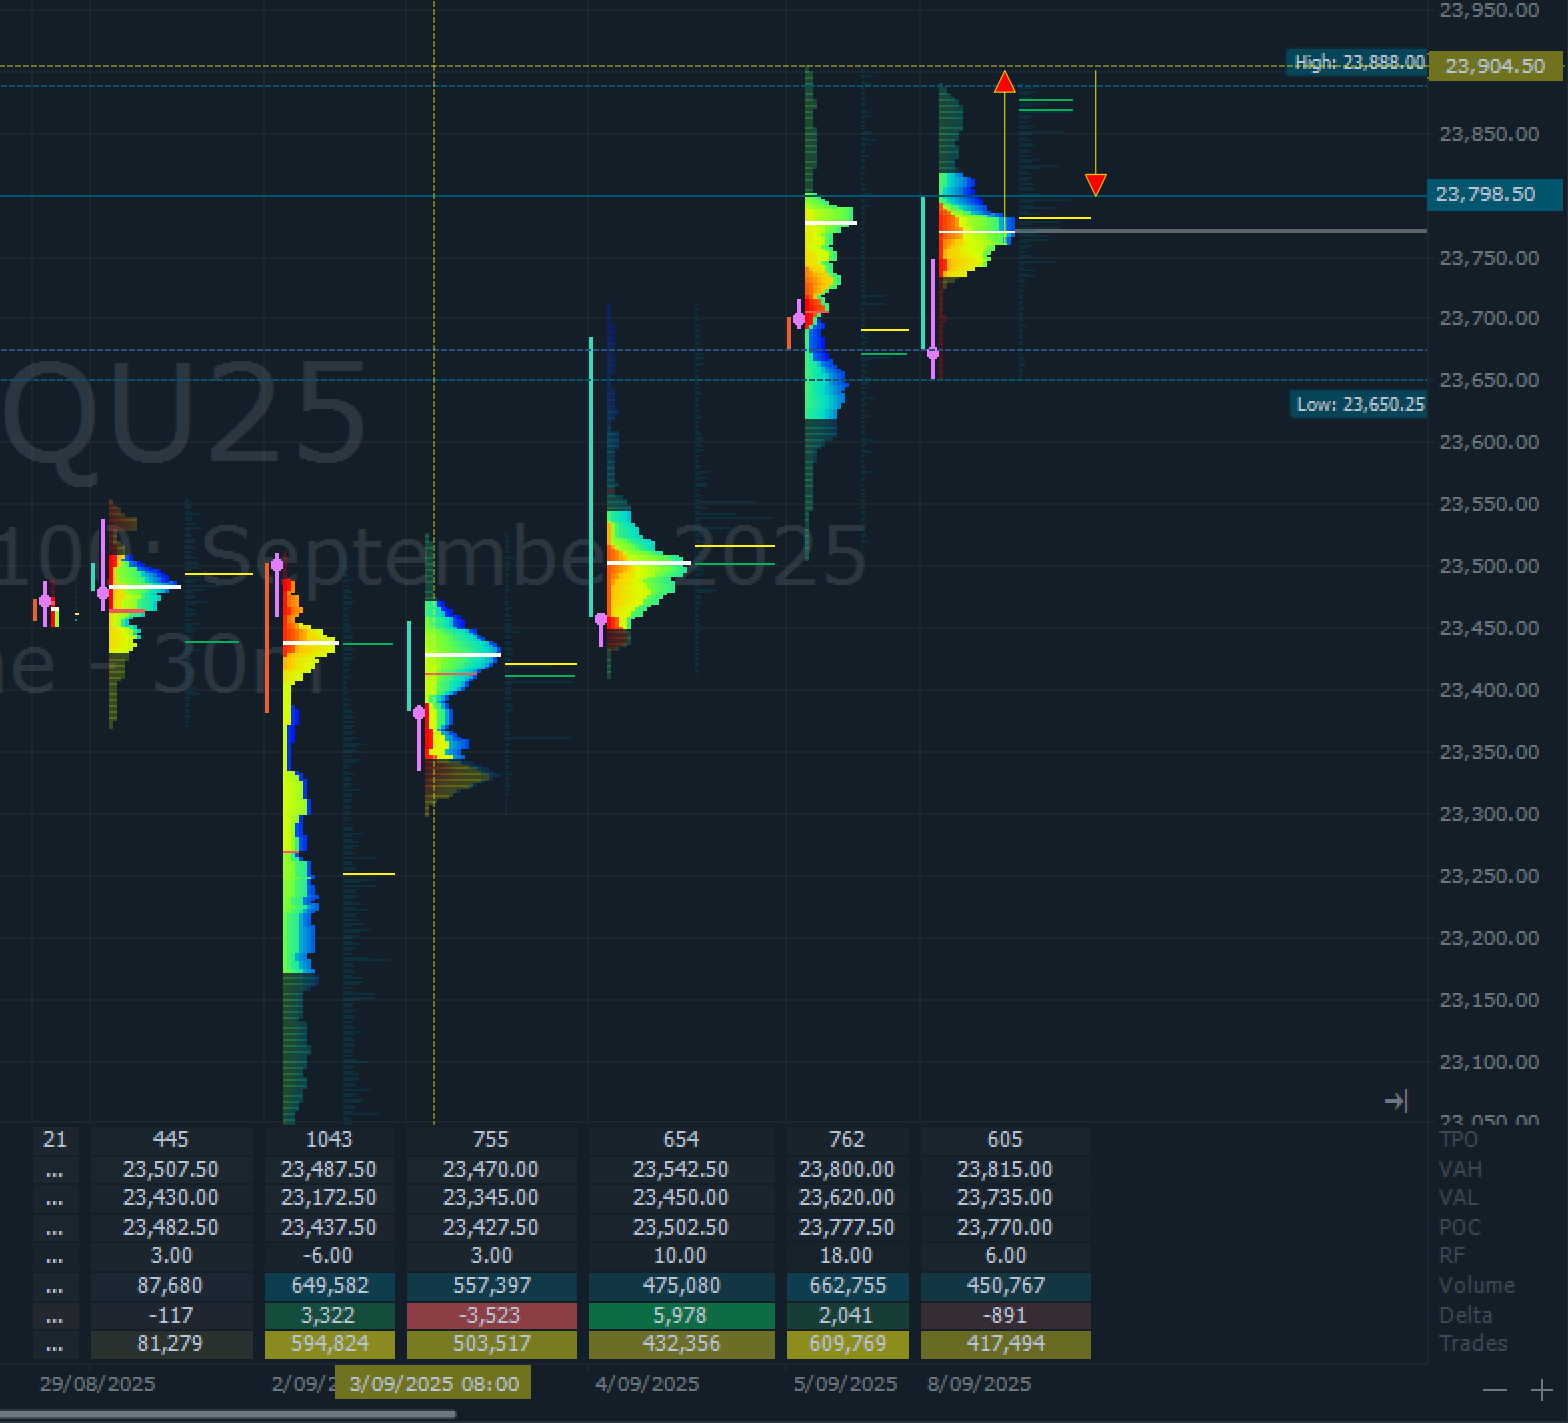
Nasdaq Futures volume analysis 8 Septemebr
What matters next (simple decision tree)
Bullish path (higher-probability if 23,748 holds):
- Hold above 23,748 on the Asia/London hand-off.
- Reclaim 23,770–23,780 POC band and micro-2 (23,766).
- Convert 23,819 → 23,857 (micro-5) into support.
- Squeeze targets: 23,905 (upper channel tag) then 24,052 on the daily.
Bearish path (if 23,748 breaks and holds below):
- Acceptance below 23,748 shifts control to sellers.
- First magnets: 23,680 and 23,593 (bottom of the intraday channel).
- If liquidity thins, extension levels line up at 23,454 → 23,368 → 23,228.
How to read it using the MacroStructure rules
- Setup, not chase: The morning move from micro-2 to micro-5 delivered the day's clean rotation. After a micro-5 tag, expect mean-reversion first, continuation second—today followed the script.
- Context beats headline: Friday's data shock broke structure only temporarily. Until 23,748 fails on a closing basis, the working bias is buy-the-dip into 1–2 and fade near 5–4.
- Confirmation cues: Watch delta and volume inside 23,770–23,780. If buyers can't hold that fight zone, the market will likely test 23,680/23,593 where responsive bids have been waiting.
Bottom line
The contract is balanced above a key daily pivot with buyers defending every dip. Hold 23,748, and the auction can rotate higher toward 23,905 and 24,052. Break and accept below 23,748, and we likely revisit 23,680–23,593 before the next decision. Keep it simple: buy 1–2 when structure aligns; take profits into 5–4.
This analysis is for education and market commentary only. It is not investment advice or a solicitation to buy or sell any security or derivative. Trading futures and crypto involves substantial risk and is not suitable for every investor. You can lose more than your initial investment. Past performance does not guarantee future results. Always do your own research and use defined risk with stops. The author may hold positions aligned or not aligned with the views expressed and may change them without notice.
Author

Denis Joeli Fatiaki
Independent Analyst
Denis Joeli Fatiaki possesses over a decade of extensive experience as a multi-asset trader and Market Strategist.


