Nasdaq futures hold constructive structure as price digests prior expansion

Nasdaq futures continue to trade within a broader bullish framework, with structure and intraday behaviour guiding context across global sessions.
Nasdaq futures continue to trade within a broader constructive structure, even as recent price action reflects a period of consolidation following a prior expansion. As global sessions unfold across Asia, London, and New York, market structure and price behaviour remain the primary tools for framing context rather than anticipating outcomes.
Rather than treating the recent pullback as a directional shift, the current environment appears consistent with a normal digestion phase within an established bullish framework.
Higher-timeframe structure remains intact
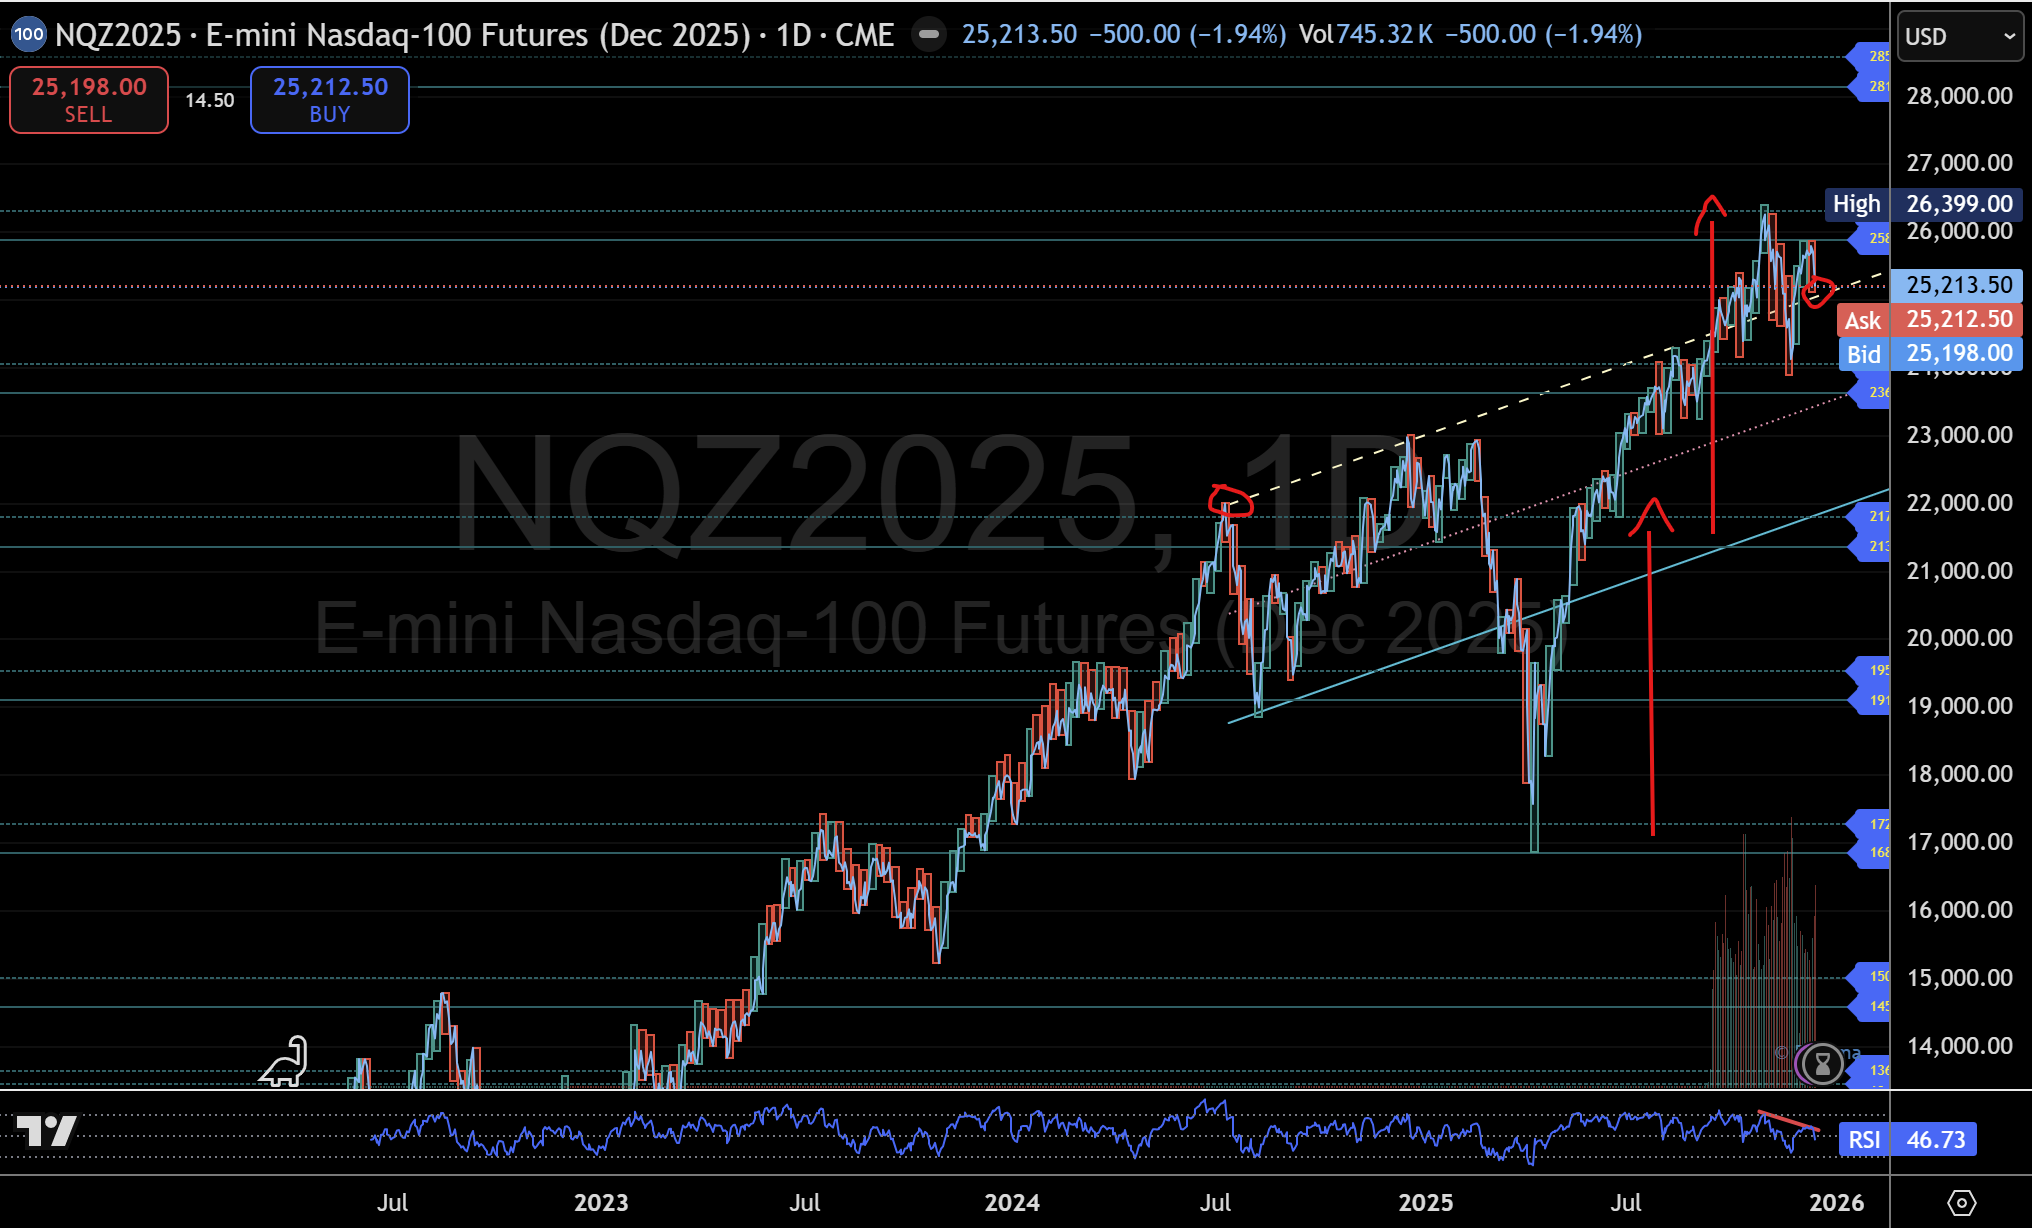
From a daily perspective, Nasdaq December futures continue to respect the dominant structure that has guided price since the April low. The broader trend remains constructive, with recent weakness appearing as a pause following a prior expansion rather than a breakdown in structure.
The retreat from recent highs aligns with a normal daily extension and rotation, interacting with a supply area that has acted as a natural pause within the broader trend. Importantly, this behaviour remains consistent with the prior structural relationship between the April low and the June breakout zone, reinforcing the view that the market is still operating within an established roadmap.
As long as price continues to respect this higher-timeframe framework, the broader bullish structure remains intact, even if short-term volatility persists.
Daily risk context and structural references
Within the current framework, the region around the upper supply reference remains a key area to monitor. A sustained failure to hold above this zone would shift focus toward lower daily demand, opening the door for a deeper rotation within the existing trend.
Such a move would be viewed as a structural retracement rather than a change in directional bias, provided price continues to respect higher-timeframe support levels. This distinction is important, as it separates normal corrective behaviour from genuine structural change.
Intraday structure shows balance and rotation
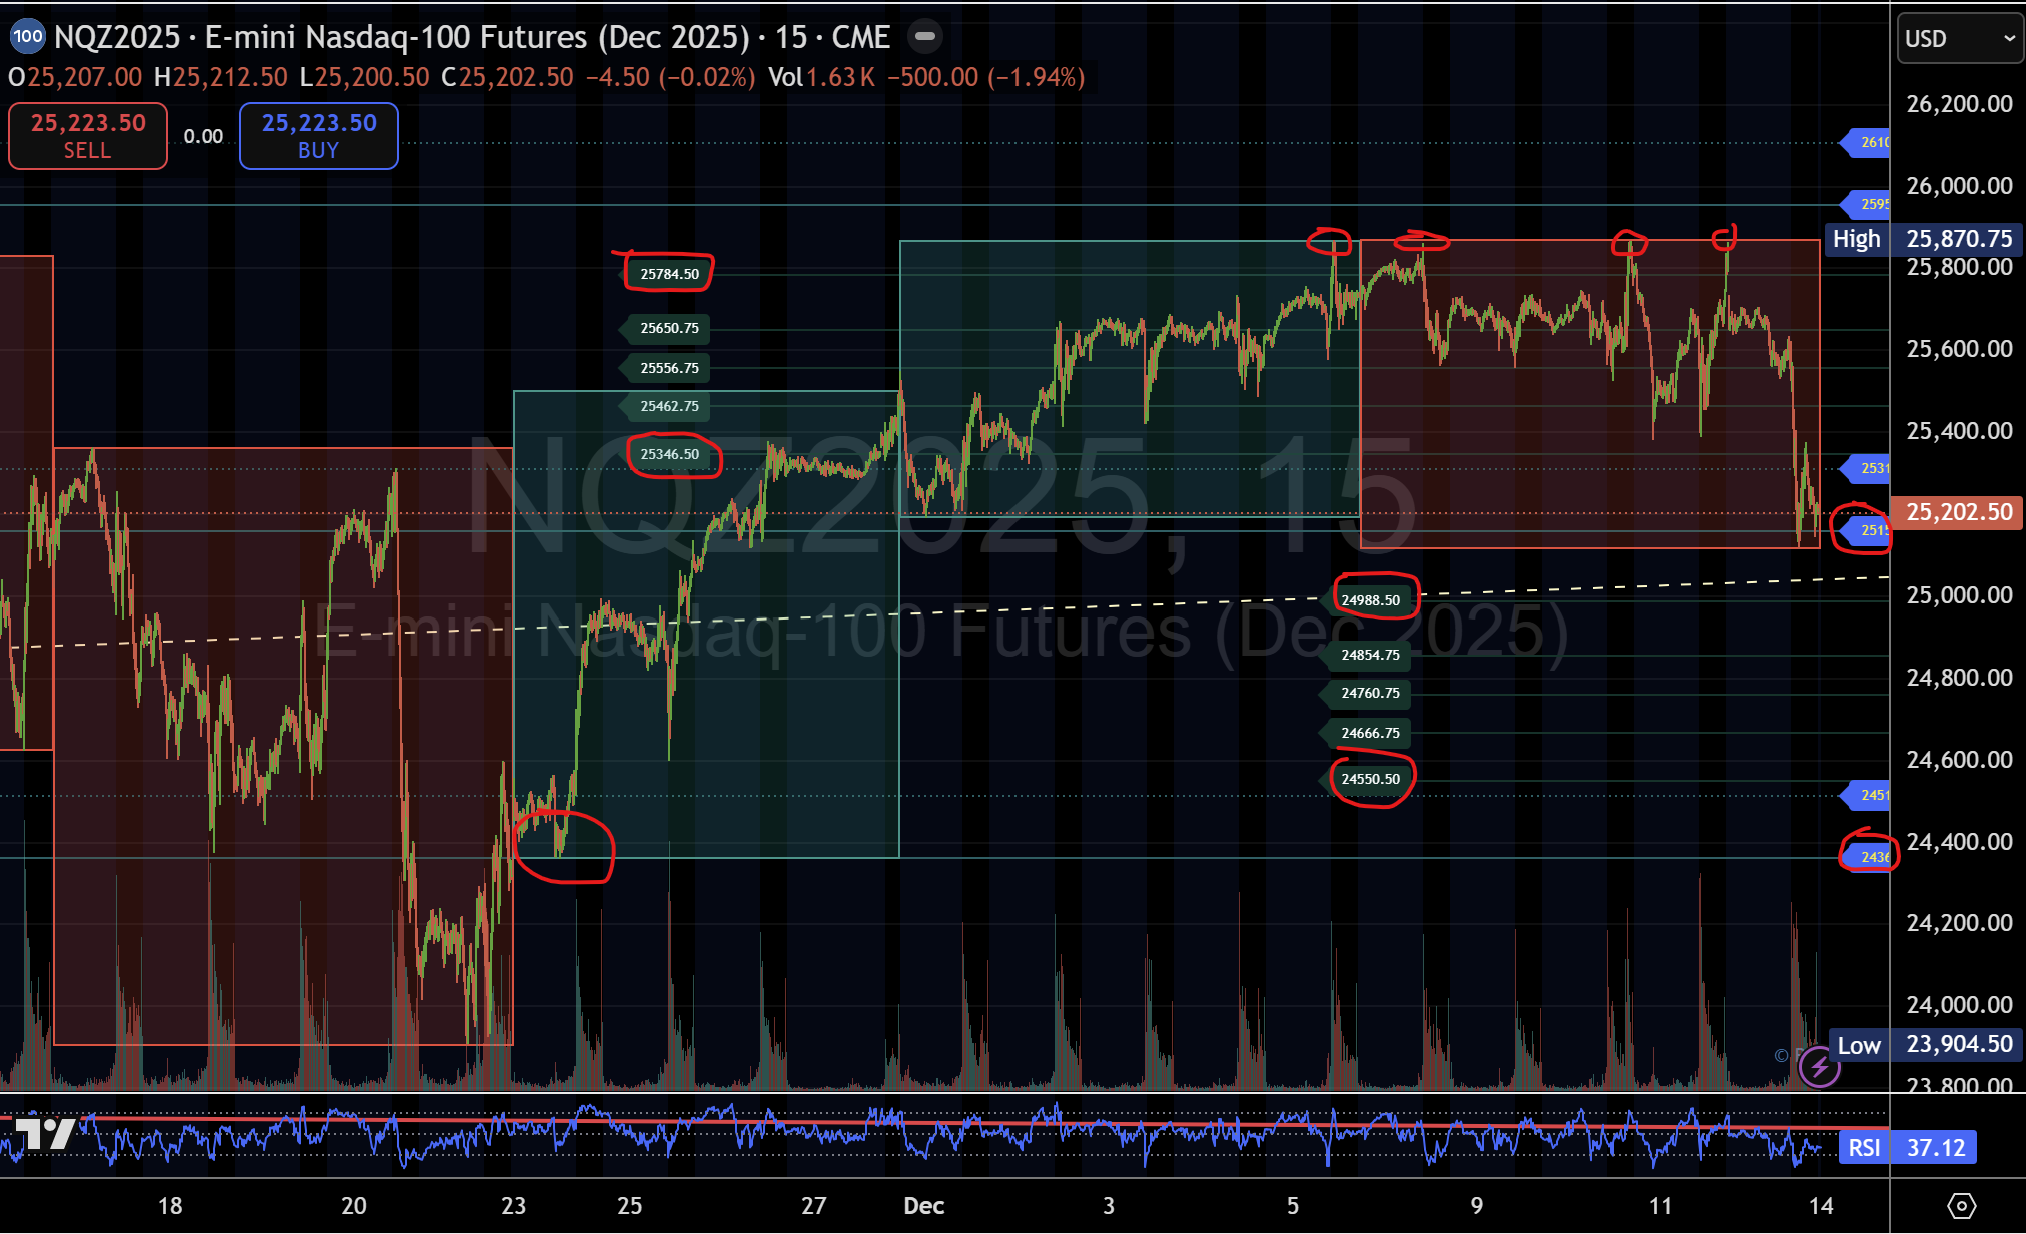
On the 15-minute timeframe, Nasdaq futures continue to trade within a well-defined intraday structure that has been active since late November. Over the past two weeks, this structure has supported both expansion and consolidation phases, providing a clear framework for understanding recent price behaviour.
Repeated attempts to sustain acceptance above the upper intraday structure were met with rejection, resulting in a rotation back toward the middle of the range. This behaviour suggests the market remains in balance at the intraday level, rather than transitioning into an impulsive trend.
Key intraday pivot defines session behaviour
From an intraday perspective, a central pivot level remains the main behavioural divider for the session. Holding above this area keeps price within the upper half of the intraday structure, while failure to do so would suggest a rotation back toward lower structural references.
If price stabilises above this pivot, the intraday framework remains open for a retest of the upper structure, where price behaviour may again provide useful information. Conversely, a failure to hold would shift attention toward lower intraday demand, consistent with a rotation rather than a breakdown.
Behaviour over prediction
Across both the daily and intraday timeframes, the focus remains on how price behaves around structure, rather than on forecasting direction. Consolidations, rotations, and volatility are all part of price discovery, particularly following extended expansions.
As global sessions continue to unfold, structure provides the framework, while behaviour offers the clearest signals for how the next phase may develop.
Author

Denis Joeli Fatiaki
Independent Analyst
Denis Joeli Fatiaki possesses over a decade of extensive experience as a multi-asset trader and Market Strategist.


