NASDAQ 100, S&P 500 break through support trendlines as traders wonder if rally has ended
- US Consumer Sentiment shakes equity market on Friday after showing worst reading since 2022.
- NASDAQ Composite declines over 1% on Friday for third session this week.
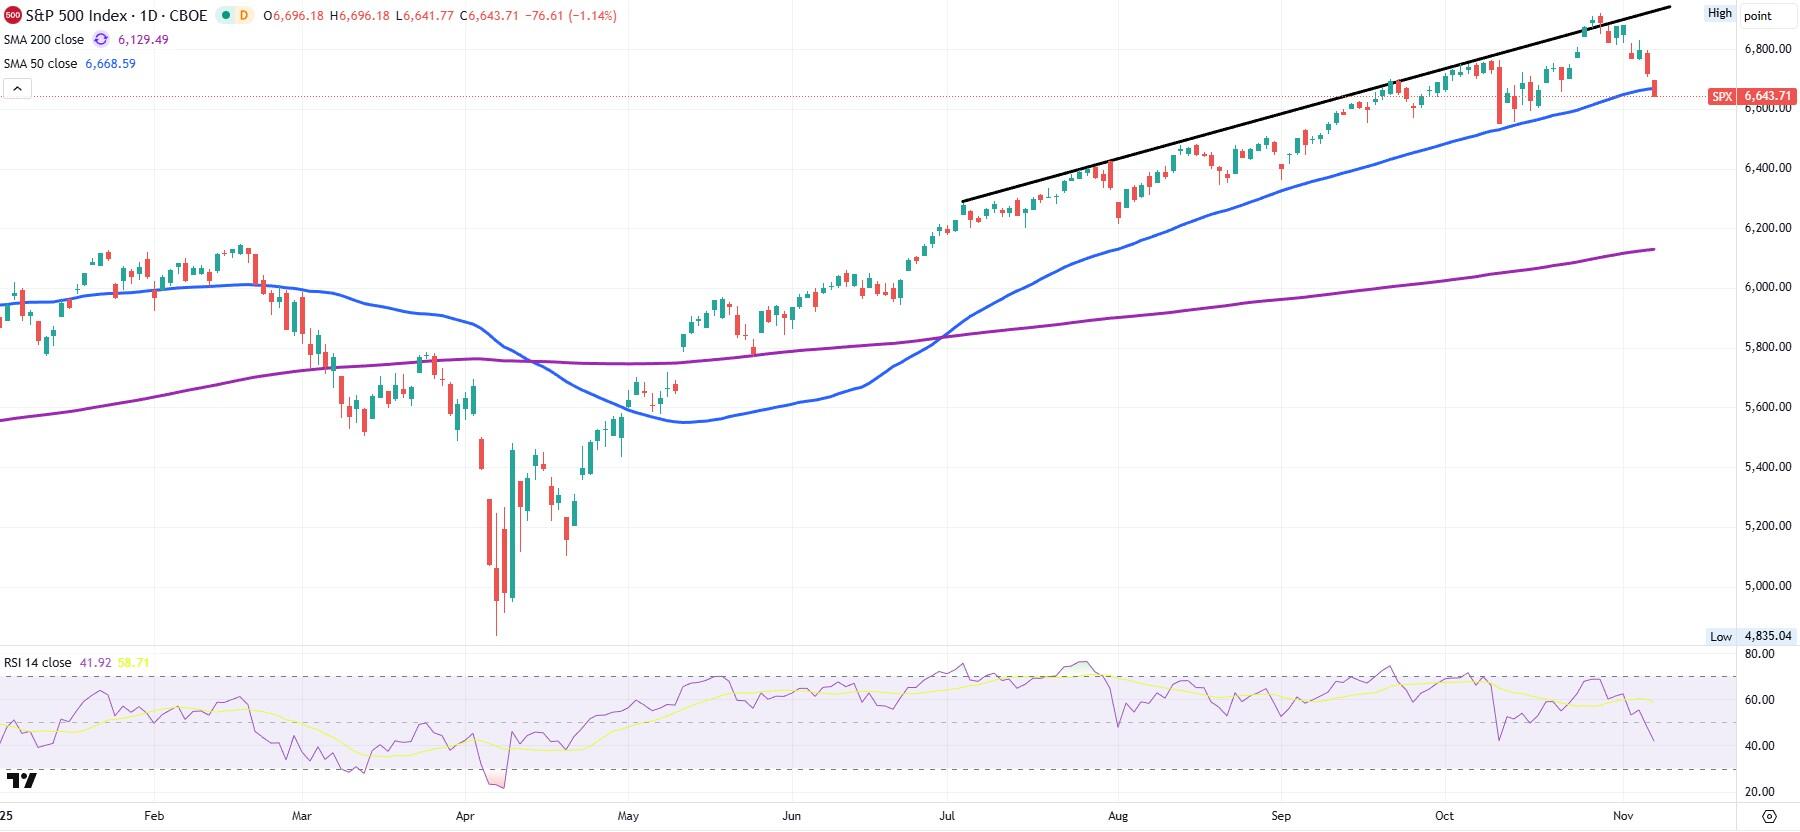
- S&P 500 breaks below 50-day moving average.
- Friday's plunge recovers after Senate Democrats make attempt to end government shutdown.
US stock markets were in flux on Friday as the NASDAQ Composite (IXIC) saw its third greater than 1% drop this week. With 90 minutes to go before the session closes, the S&P 500 (SPX) has declined 2.6% this week so far, while the IXIC fell a heavier 4.2%.
Much of the weakness has been felt in tech stocks, which are losing their luster after a swift six-month rally. Noted short-seller Michael Burry's 13F filing early in the week showed that he seemed to be betting the majority of his family office's money on shorting 1 million shares of Nvidia (NVDA) and 5 million shares of Palantir (PLTR). Then on Thursday, Challenger, Gray & Christmas released its findings that US corporations had done 153K layoffs in October, 175% higher than a year earlier and the largest October reading since 2003. The company said it was the worst fourth-quarter month since the 2008 financial collapse.
It didn't help matters when the OpenAI CFO seemed to be suggesting that the private company needed a government "backstop" to continue implementing its $1.4 trillion buildout of data centers. And although that statement was later walked back, reporting on private speeches from Nvidia CEO Jensen Huang in Taiwan emerged that show he expects China to lead the world in AI by 2027. The reporting suggests that Huang is worried about Huawei's Ascend910C chip already running as little as 8% behind Nvidia's own AI chips.
Then the preliminary Michigan Consumer Sentiment Index for November on Friday dropped from October's 53.6 to 50.3. The index is now at its lowest ebb since 2022. News that Senate Democrats were putting forth a plan to end the US federal government shutdown helped markets recover some losses on Friday, but it didn't happen before multiple lower trendlines were broken across technical charts.
The week in charts: Can the bear market continue?
The S&P 500 broke below the 50-day Simple Moving Average (SMA) on Friday. The index is now in a situation it hasn't been in since late April. First, however, traders will watch to see if the S&P 500 breaks below the October 10 low at 6,550 next week. A break there would mean the first lower low in six months and would then place the 200-day average at 6,130 in play.
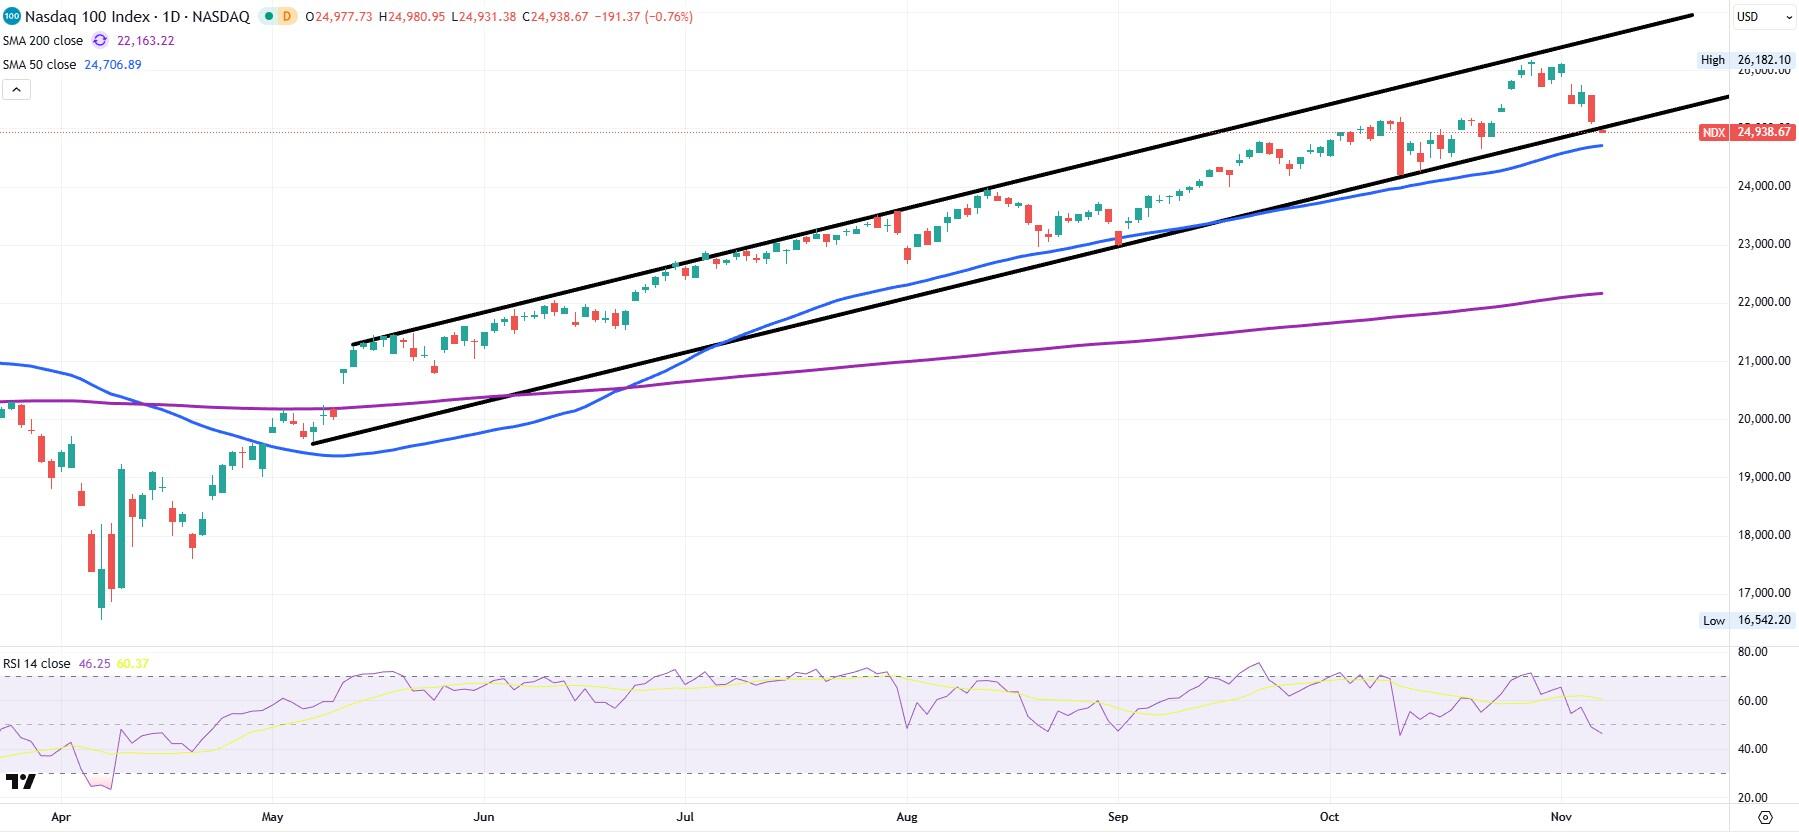
The NASDAQ 100 (NDX) opened below the medium-term supportive trendline for the first time since it began in May. The 50-day, however, is yet to be broken. If the NDX can right the ship and rally hard on Monday, traders might view this past week's pullback as just a momentary glitch in the AI rally.
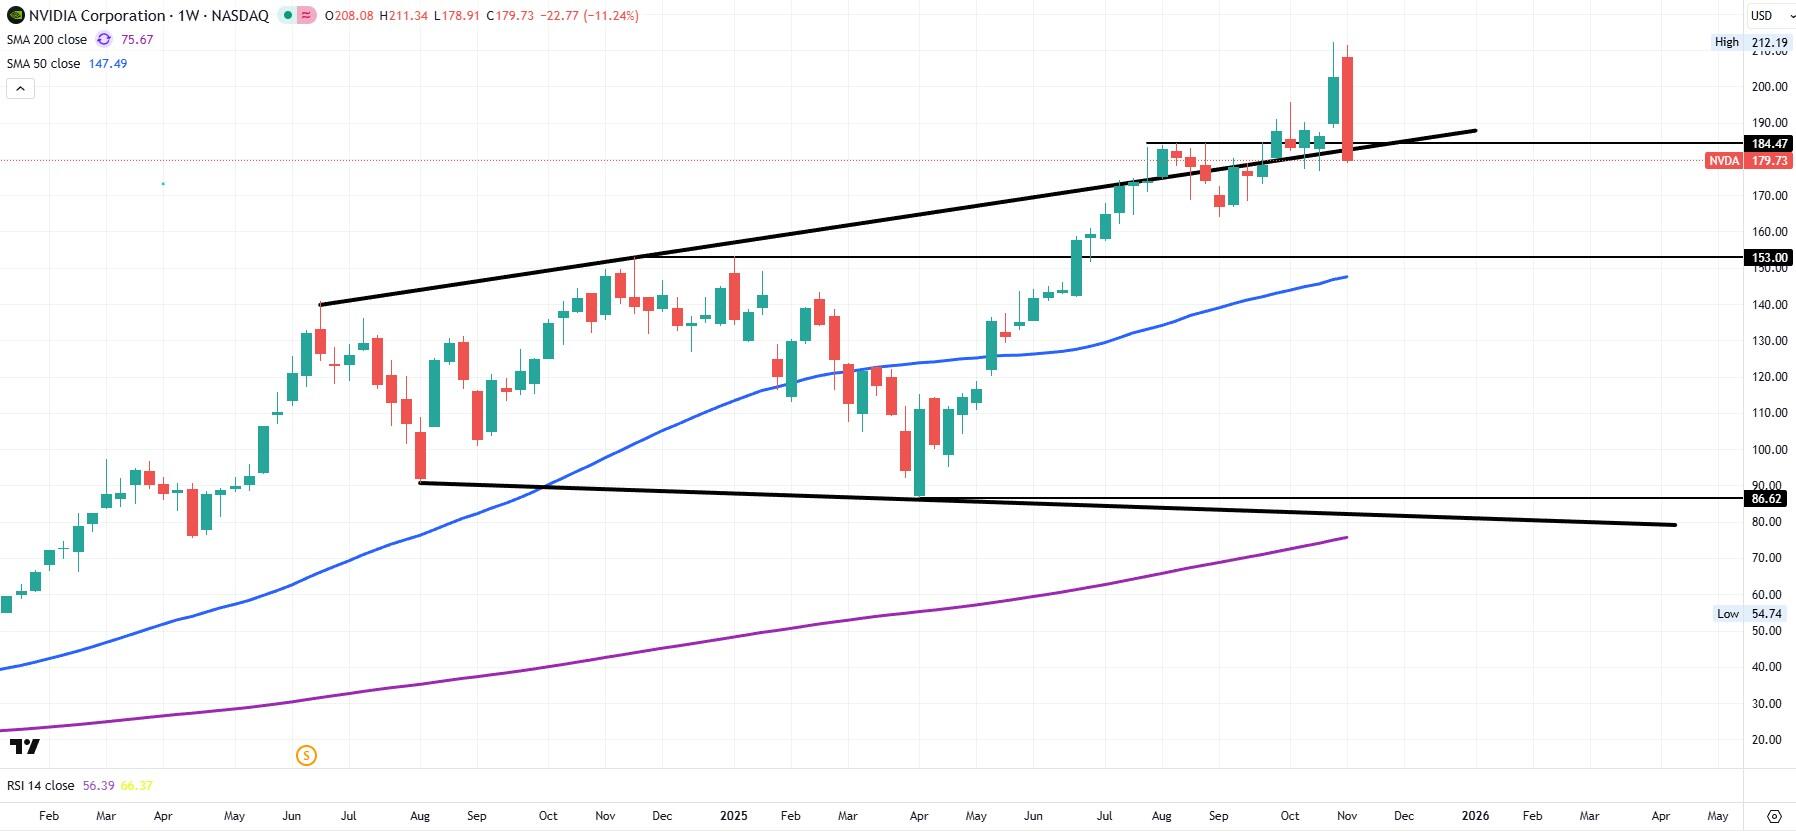
Nvidia stock fell below $179 briefly on Friday. The weekly chart below shows that it can be seen as a retest of the former top trendline that it broke above in August. Even despite Nvidia's recovery on Friday afternoon, shares of the leading AI chipmaker are down more than 7% for the week. However, bears need a confirmed close below the trendline to really exacerbate worries. Prior resistance at $153 is viewed as long-term support for Nvidia if the rally does subside this holiday season.
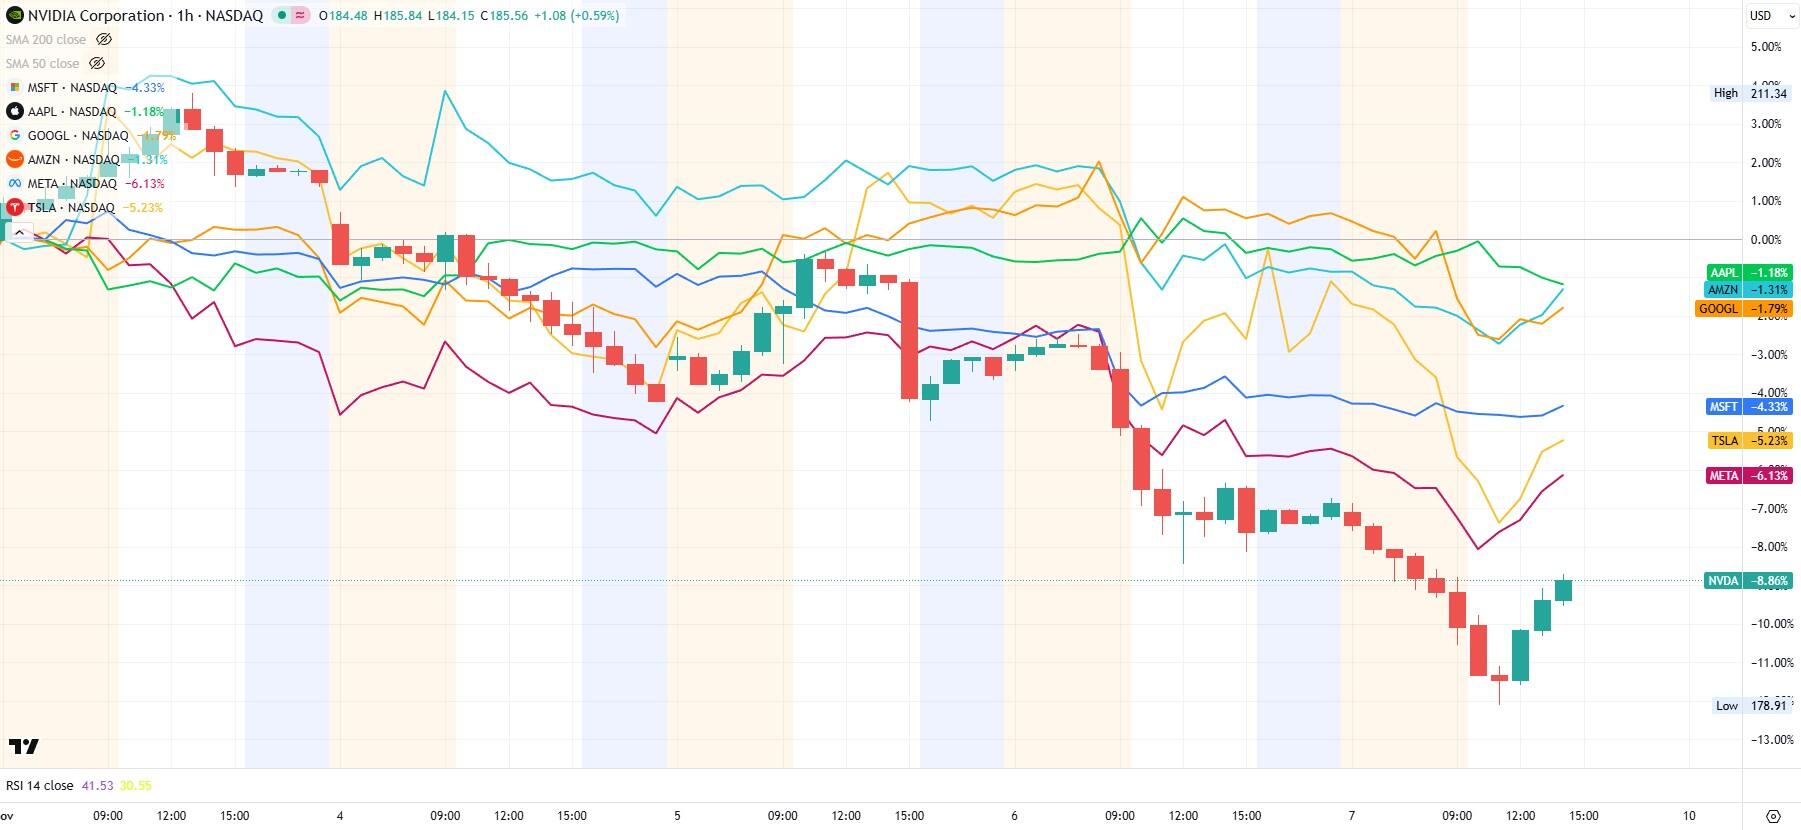
Last of all, all seven Magnificent 7 stocks rotated lower this week. So far, the performance isn't that bad, and Apple (AAPL), Amazon (AMZN) and Alphabet (GOOGL) are all over-performing the major indices. But Nvidia's poor performance compared to the rest of the lot is a sign is a troubling sign. While the entire Mag 7 hinges on the success of AI, Nvidia has been the poster boy for this rally, and any weakness from the leader tends to shake the confidence of the entire market eventually.
Author

Clay Webster
FXStreet
Clay Webster grew up in the US outside Buffalo, New York and Lancaster, Pennsylvania. He began investing after college following the 2008 financial crisis.