|

Nasdaq 100 Elliott Wave update: New ATHs are on tap

In our December update, we combined the Elliott Wave (EW) Principle with the Armstrong Pi-cycle turn dates and concluded for the NASDAQ 100 (NDX) that

“…if the November 21 low at 23854 holds, based on current data, the Bull market will likely continue, ideally well into April next year, before a 2022-like Bear market begins. Below that level, it will strongly suggest that the bear market is already underway.

Closer to home, we

“… adjusted our perspective to view the [December 10] 25835 high as only the gray Wave-i of a larger (green) 5th wave, with W-ii to ideally ~24600 now underway.”

Fast forward to today. The index bottomed at 24647 (gray W-ii), rallied to 25716 on December 26 (orange W-1), bottomed out on January 2nd at 25086 (orange W-2), and is now trading in the 25700s. Thus, the Bulls held the November lows elegantly, and the index is most likely advancing in the 3rd of a 3rd wave (orange W-3 of gray W-iii) for the final 5th wave (green W-5). See Figure 1 below.

Figure 1. Short-term Elliott Wave count for the NDX

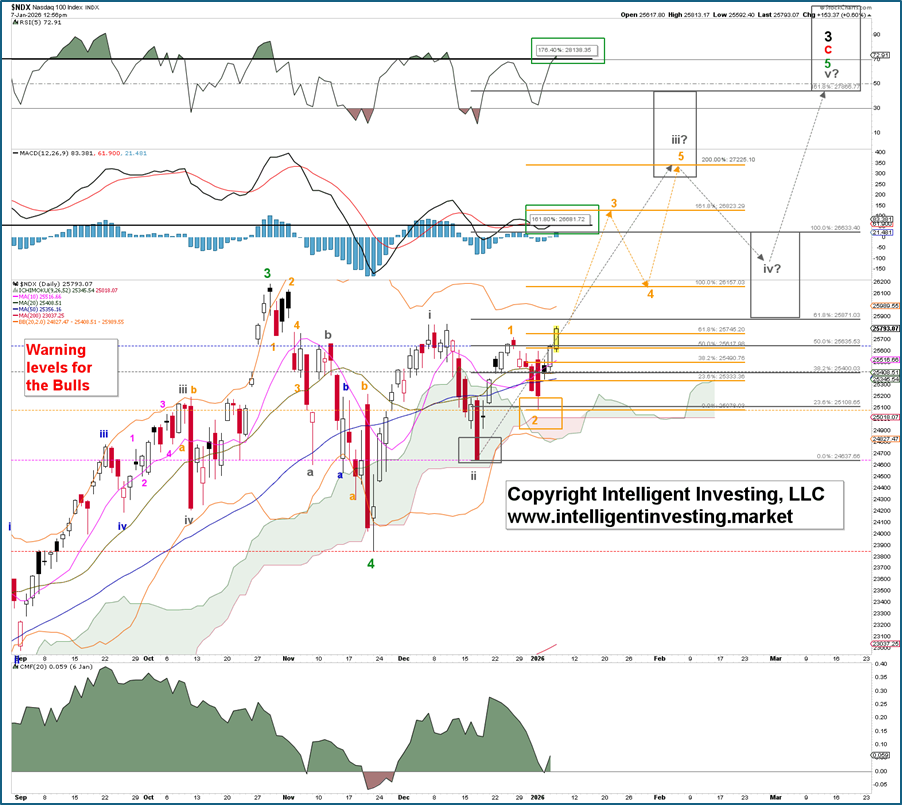
Contingent on price remaining above the warning levels*, with each successive break below increasing the odds by 20% that the uptrend has ended, we expect the index to ideally reach ~26825 for the orange W-3, then drop to ~26155 for the orange W-4, and rally to approximately 27225 for W-5, etc. Here, the standard impulse pattern is shown; however, the green W-5 can also develop into an overlapping ending diagonal, resulting in an overlapping rally to the lower end of the target zone (~27860). For now, we have no indication that this will occur. But make no mistake, once this green W-5 completes, we still expect a 2022-like bear market before the next larger multi-year rally to new ATHs can start.

*Warning levels for the Bulls: 25639, 25428,25086, 24647, and 23854. These will be adjusted upwards when the index continues to rise.

Author

Dr. Arnout Ter Schure

Dr. Arnout Ter Schure

Intelligent Investing, LLC

After having worked for over ten years within the field of energy and the environment, Dr.

More from Dr. Arnout Ter Schure
Share:

Editor's Picks

AUD/USD eyes 0.7150 barrier nine-day EMA

AUD/USD inches higher after registering modest losses in the previous day, trading around 0.7130 during the Asian hours. The technical analysis of the daily chart indicates that the pair is moving sideways within the rectangle pattern, suggesting a consolidation as neither the bulls nor the bears have enough momentum to take control of the market.

USD/JPY trades below 160.00 intervention threshold; bullish bias intact

The USD/JPY pair attracts some sellers during the Asian session amid fears that authorities will step in again to prop up the Japanese Yen. Furthermore, the Israel-Lebanon truce prompts some profit-taking around the US Dollar and exerts downward pressure on the currency pair.

Gold defends 200-day SMA at $4,425, but for how long?

Gold is attempting a tepid recovery toward $4,500 early Thursday, as renewed optimism in the Mideast geopolitical front calms market nerves. This cautious optimism across Asian markets weighs on Oil prices, and diminishes the US Dollar’s safe-haven appeal, helping Gold stage a decent comeback from the weekly low of $4,424.


Hyperliquid: ETF demand, capital rotation fuel HYPE rally as Bitcoin melts

Hyperliquid price sustains an upward trend near its all-time high of $75.76 on Thursday after posting 80% gains in May, while Bitcoin (BTC) retraces below $65,000, triggering a market-wide panic.

Kevin Warsh takes the Fed helm: What it means for the US Dollar
The Federal Reserve moves away from the highly predictable "forward guidance" model of the Jerome Powell era to a new “Kevin Warsh environment”, characterized by less communication, more policy surprises, and an increased focus on the Fed's complex balance sheet.
Recession on paper: What really moves the Canadian Loonie now?

Statistics Canada handed the headline writers a gift and the analysts a headache. Real GDP shrank 0.1% on an annualized basis in the first quarter, and with the fourth quarter of 2025 revised down to a 1.0% contraction, that is two negative quarters in a row, the textbook definition of a technical recession and Canada's first since the pandemic.