MULN stock tumbles over 6% but defends $1.33 demand area
- MULN stock tumbles despite the rebound in Wall Street indices.
- MULN stock is still a long way from previous highs as investors remain cautious.
- MULN stock reacts to Buzz EV article but not to Hindenburg.


Update: MULN failed to sustain the minor recovery mode and turned south once again, shedding over 6% on the day. The stock price ended Monday at $1.39 after finding some support once again near $1.33. The stock price bucked the trend on broader Wall Street indices, as claims made by Hindenburg Research. Hindenburg Research ("Hindenburg") published a report earlier this month, addressing Mullen, entitled "Mullen Automotive: Yet Another Fast-Talking EV Hustle", calling the Company among the worst electric vehicle ("EV").
MULN stock finally caught a break on Friday that saw it close over 5% higher at $1.48. That came after a series of losses that have seen MULN stock move from $4.18 in March as investors cut positions aggressively and shorts too entered the fray in MULN. For those not aware Mullen Automotive is another EV maker, this time based out of the US. It is in the early stages and does not see production until 2024 or 2025 according to Marion Petrelecan of Mullen.
MULN stock news
As far as we are aware the company still has not responded to claims made by Hindenburg Research. Some of those claims were extremely negative and led to a sharp fall in the share price of MULN. The report titled "Yet Another Fast Talking EV Hustle" outlined details of limited research spending despite claims of groundbreaking battery range. Other claims made in the report are of its vans actually being imports rebranded for Mullen, the company having no EPA certs to sell its vehicles, issues over its Dragonfly supercar as well as issues it raises over MULN management. Strong claims indeed and ones that you would think would warrant a strong response from MULN management. Of course, Mullen or its executives are under no obligation to comment on the contents of the Hindenburg report but seeing as how management sees fit to comment on positive reports it does grate a little. If the claims made by Hindenburg are incorrect or at the very least questionable you would expect management to come out and say so. Instead, they comment on a report from The Buzz. "We had a great discussion with David from The Buzz. I appreciate The Buzz taking time to get to know more about Mullen Automotive and offering their readers a chance to also learn more about our company and our EV vision," CEO David Michery said.
In the same interview, the debut date for the Mullen 5 is also not exactly imminent
"When will the first iteration be hitting the streets? Marian Petrelecan: We are shooting for ’24, ’25, probably more like the spring of ’25". Three years then, a lot can happen in 3 years folks. In 3 years every major auto manufacturer in the world will be partially electric if not fully.
MULN stock forecast
Whatever your view of the Hindenburg report and we should of course say we are merely reporting its contents, we do not have any visibility on how accurate or inaccurate it is. But the stock remains under pressure, despite Friday's bounce. Breaking $2.06 really sped up selling momentum. MULN, of course, is a momentum play so when it fades it is time to get out. MULN stock has struggled to reach the top of social media mentions over the past 10 days. But the real key was the shooting star candle on March 21. Most of these retail frenzies end in a shooting star, a candle where the close is much lower than the intraday high. That speaks to a failure to sustain momentum throughout the session. In fact, another notable signal to watch for is a huge premarket spike that is not sustained into the regular session. The premarket is not as liquid so it is much easier for a stock price to spike. The regular session will be more "real volume". $1.55 which is Friday's low is the short-term pivot, below more losses will ensure. Above and we may get some stabilization.
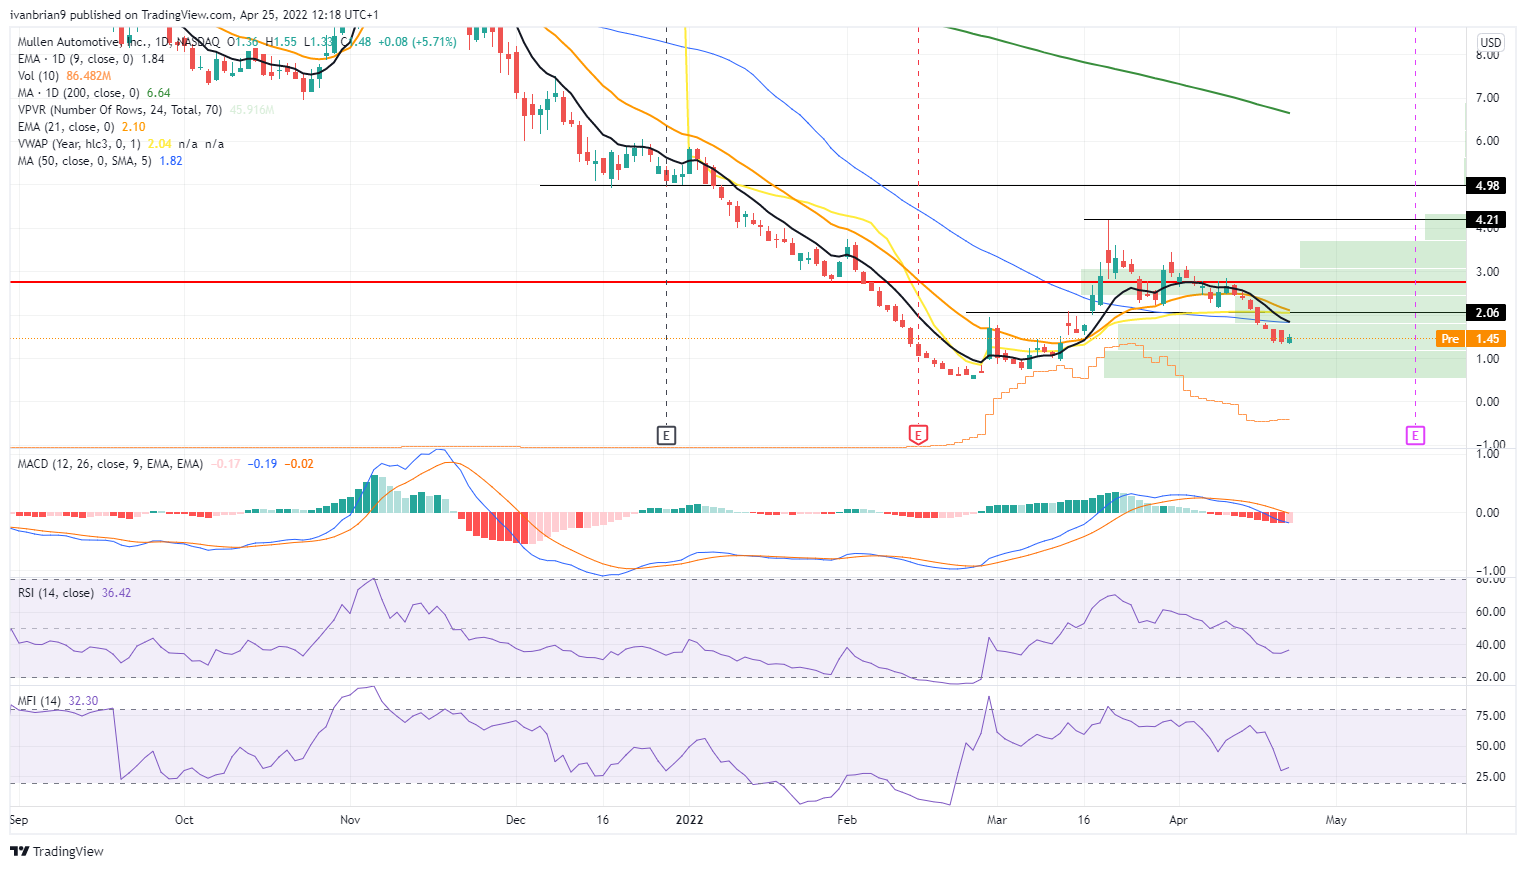
MULN stock chart, daily
Previous updates
Update: MULN has stalled on the offer in a critical area of support as per the daily chart and the mid-March resistance that would be expected to now act as support. This comes in at $1.39. A 50% mean reversion comes in at $2.09 where it meets the prior support before the sell-off from $2.85 on April 11. On the other hand, should the stock continue to fall, then $0.54 will be back on the cards.
Author
Ivan Brian
FXStreet
Ivan Brian started his career with AIB Bank in corporate finance and then worked for seven years at Baxter. He started as a macro analyst before becoming Head of Research and then CFO.

















