MQG Elliott Wave analysis and Elliott Wave forecast [Video]
![MQG Elliott Wave analysis and Elliott Wave forecast [Video]](https://editorial.fxstreet.com/images/Markets/Equities/Nikkei/nikkei-225-index-17329557.jpg)
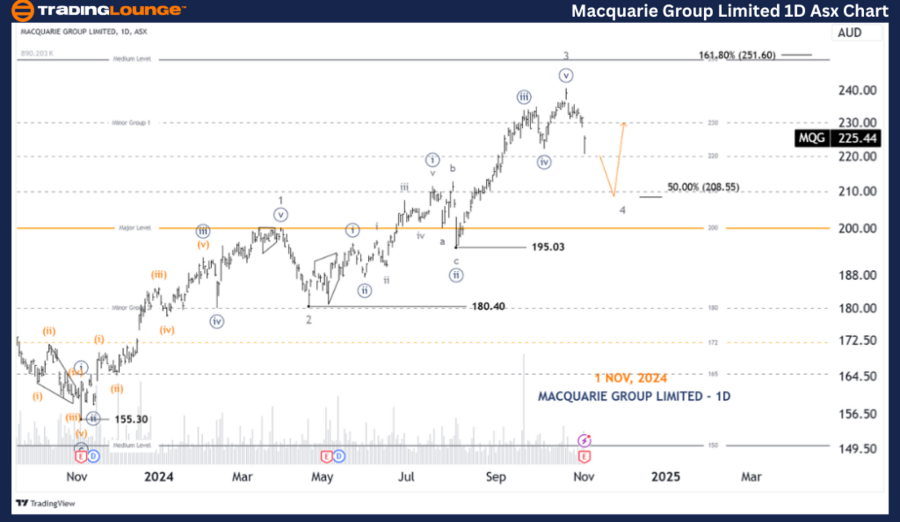
ASX: MACQUARIE GROUP LIMITED - MQG Elliott Elliott Wave Technical Analysis TradingLounge (1D Chart).
Greetings, Our Elliott Wave analysis today updates the Australian Stock Exchange (ASX) with MACQUARIE GROUP LIMITED - MQG. We see MQG.ASX still having a push lower, and preparing for a future 5-grey wave rally.
ASX: Macquarie Group Limited - MQG 1D chart (Semilog scale) analysis
Function: Major trend (Minor degree, grey).
Mode: Motive.
Structure: Impulse.
Position: Wave 4-grey.
Details: Wave 3-grey has ended and wave 4-grey is unfolding to push lower, targeting around 208.55, after which wave 5-grey could return to push higher.
Invalidation point: 200.00.
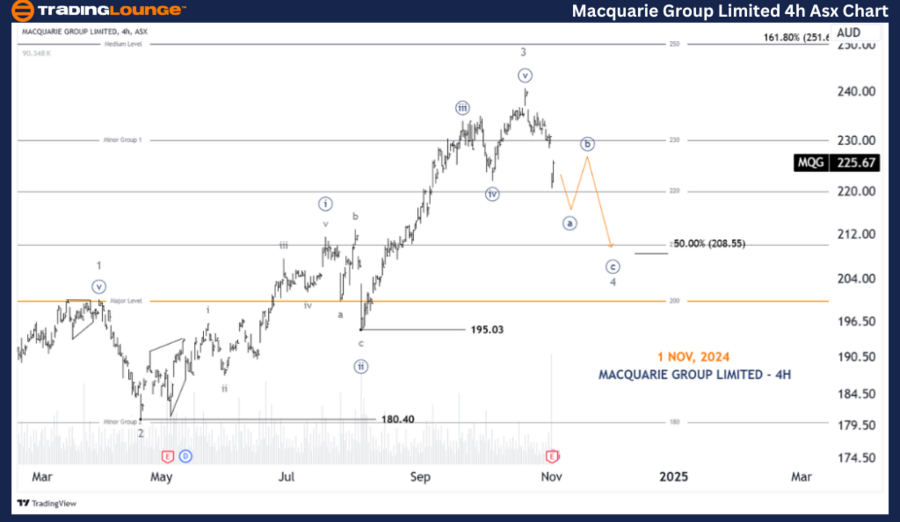
ASX: Macquarie Group Limited - MQG four-hour chart analysis
Function: Major trend (Minor degree, grey).
Mode: Motive.
Structure: Impulse.
Position: Wave ((a))-navy of Wave 4-grey.
Details: Wave 4-grey is unfolding to push lower, and it is probably developing as a Zigzag, labeled ((a))((b))((c))-navy. Its retracement target will probably continue to push lower for one more time. And after wave 4-grey is complete, wave 5-grey could return to push higher.
Invalidation point: 200.00.
Conclusion
Our analysis, forecast of contextual trends, and short-term outlook for ASX: MACQUARIE GROUP LIMITED - MQG aim to provide readers with insights into the current market trends and how to capitalize on them effectively. We offer specific price points that act as validation or invalidation signals for our wave count, enhancing the confidence in our perspective. By combining these factors, we strive to offer readers the most objective and professional perspective on market trends.
Technical analyst: Hua (Shane) Cuong, CEWA-M (Master’s Designation).
ASX: Macquarie Group Limited - MQG four-hour chart analysis [Video]
Author

Peter Mathers
TradingLounge
Peter Mathers started actively trading in 1982. He began his career at Hoei and Shoin, a Japanese futures trading company.


