MicroStrategy Inc. (MSTR) Elliott Wave technical analysis

MSTR Elliott Wave technical analysis
Function: Trend.
Mode: Impulsive.
Structure: Motive.
Position: Minor wave 3.
Direction: Upside into wave 3.
Details: We are looking at either upside into wave 3, or else we could have had a sideways wave (4) and we could now be correcting in minor wave 2 instead of minuette {ii}.
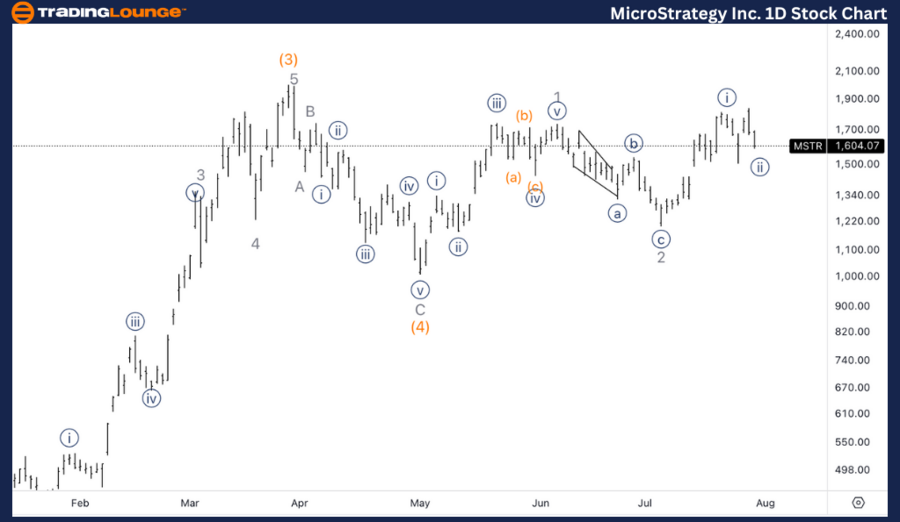
MSTR Elliott Wave technical analysis – Daily chart
The daily chart suggests that MSTR is either continuing its upside move into wave 3 or could have experienced a sideways wave (4). In the latter case, MSTR might currently be correcting in Minor wave 2 rather than in Minuette wave {ii}. The overall bullish trend indicates the potential for further gains as wave 3 unfolds.
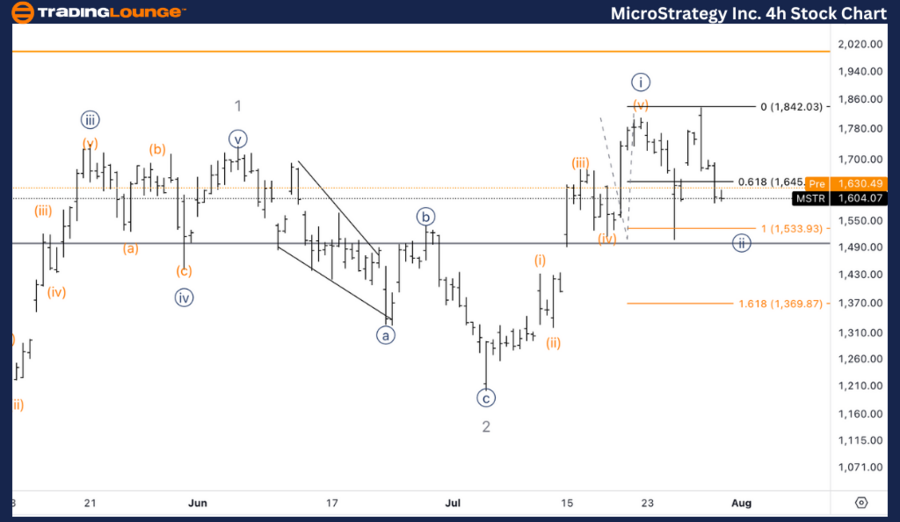
MSTR Elliott Wave technical analysis – Four-hour chart
On the 4 - hour chart, we observe a five - wave move into wave {i}, followed by a corrective wave {ii}. The equality of wave (c) versus wave (a) stands just above $1500, which is a key support level to watch. This suggests that wave {ii} might be approaching its bottom, and we could soon see the resumption of the upward move into wave 3.
Function: Trend.
Mode: Impulsive.
Structure: Motive.
Position: Wave {ii} of 3.
Direction: Bottom in wave {ii}.
Detalis: Looking for a bottom in wave {ii} to end the correction as we seem to have had a five wave move into wave {i}. Equality of (c) vs. (a) stands at just above 1500$, which is where we could expect support.
This analysis of MicroStrategy Inc. (MSTR) focuses on the Elliott Wave Theory to interpret market movements and forecast future price action. The analysis includes insights from both daily and 4-hour charts to provide a comprehensive view of MSTR's current trend and potential trading opportunities.
Author

Peter Mathers
TradingLounge
Peter Mathers started actively trading in 1982. He began his career at Hoei and Shoin, a Japanese futures trading company.


