Mexican Peso firm against US Dollar ahead of US GDP, PCE figures
- Mexican Peso up, USD/MXN down nearly 1% as unexpected high inflation in Mexico may hinder Banxico’s easing policy plans.
- INEGI reveals mixed Mexican economy: Rising inflation, shrinking monthly activity, yet core prices stabilizing.
- US business activity strengthens, marked by a surge in the manufacturing index and easing inflation pressure, could underpin USD/MXN.

The Mexican Peso regains its momentum on Wednesday, rising against the US Dollar after economic data from Mexico suggests inflation is reaccelerating. This could deter the Bank of Mexico (Banxico) from easing policy rates. Meanwhile, US Treasury yields rise late in the North American session, capping the USD/MXN losses. At the time of writing, the exotic pair exchanges hands at 17.21, down by 0.55%.
The National Statistics Agency (INEGI) in Mexico revealed that inflation in the first 15 days of January was above forecasts and exceeded December’s print. Meanwhile, core prices continued to ease, signaling a continuation of the disinflation process. At the same time INEGI revealed that Mexico’s economy shrank in November, more than in October on a monthly reading, while expanding below forecasts on an annual basis.
Across the border, S&P Global announced that business activity picked up sharply in the US The manufacturing index surprisingly returned to expansionary territory and kept inflation in check as prices cooled down.
Daily Digest Market Movers: Mexican Peso strengthens as inflation exceeds forecasts
- Mexico’s mid-month inflation rose by 0.49%, exceeding forecasts of 0.38% but below December’s 0.59%, while underlying prices stood as expected at 0.25%, an improvement compared to the 0.46% print last December.
- Annually based, general inflation rose 4.9%, above forecasts and the prior’s month 4.46%, while core inflation cooled from 5.19% to 4.78%, as foreseen.
- Economic Activity in November shrank -0.5%, lower than forecasts and October’s -0.1% contraction, on a monthly basis. Annual figures dropped from 4.2% to 2.3%, below forecasts of 3.2% growth.
- The economy in Mexico is beginning to show the impact of high rates set by Banxico at 11.25%, even though most analysts estimate the economy will grow above 2% in 2024. Nevertheless, retail sales missing estimates, the economy growing below 3% in November, and inflation reaccelerating puts a stagflationary scenario in play.
- US S&P Global Composite PMI for January came in at 52.3, up from 50.9 in December, while the Manufacturing Index improved from 47.9 to 50.3. The Services Index advanced to 52.9 from 51.4.
- On the US front, last week’s economic data paints a soft-landing outlook. Even though housing data has remained mixed, improving American household sentiment , lower inflation expectations and business activity gathering steam could underpin the USD/MXN in the near term.
- Traders trimmed their bets for a dovish Federal Reserve in 2024. They stand at 139 basis points (bps) of cuts from 175 bps last week.
- Despite indications from the December meeting minutes of Banxico (the Central Bank of Mexico) that it may consider easing its monetary policy, the inflation report for January poses a potential obstacle to any such policy relaxation.
- Standard Chartered analysts estimate the Bank of Mexico (Banxico) will lower rates to 9.25% in 2024.
- On January 5, a Reuters poll suggested the Mexican Peso could weaken 5.4% to 18.00 per US Dollar in the 12 months following December.
Technical Analysis: Mexican Peso climbs to two-day high as USD/MXN drops toward100-day moving average
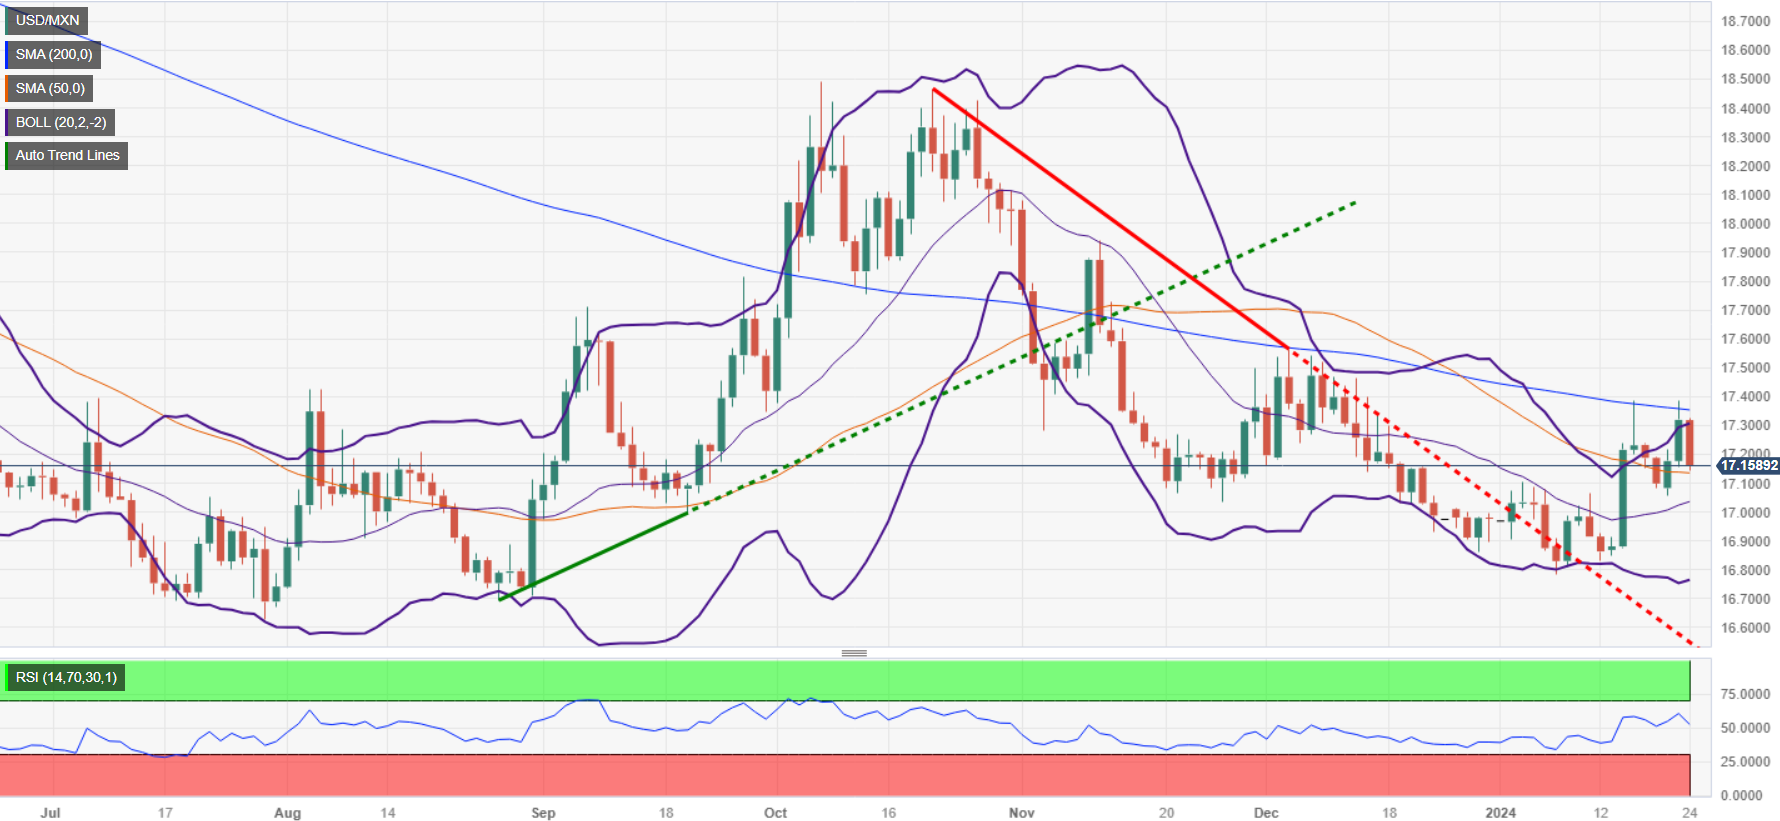
The USD/MXN erased Tuesday’s gains on Mexico’s economic data releases. Therefore, the exotic pair failed to breach the 200-day Simple Moving Average (SMA) at 17.36, extending its losses toward the 50-day SMA at 17.14. Next support is seen at 17.05, the January 22 low, followed by the 17.00 psychological figure.
On the other hand, if buyers lift the exchange rate past the 17.20 area, that could pave the way to retest the 200-DMA, followed by the 100-day SMA at 17.42. A breach of the latter will expose the psychological 17.50 mark, ahead of rallying to the May 23 high from last year at 17.99.
USD/MXN Price Action – Daily Chart
GDP FAQs
What is GDP and how is it recorded?
A country’s Gross Domestic Product (GDP) measures the rate of growth of its economy over a given period of time, usually a quarter. The most reliable figures are those that compare GDP to the previous quarter e.g Q2 of 2023 vs Q1 of 2023, or to the same period in the previous year, e.g Q2 of 2023 vs Q2 of 2022.
Annualized quarterly GDP figures extrapolate the growth rate of the quarter as if it were constant for the rest of the year. These can be misleading, however, if temporary shocks impact growth in one quarter but are unlikely to last all year – such as happened in the first quarter of 2020 at the outbreak of the covid pandemic, when growth plummeted.
How does GDP influence currencies?
A higher GDP result is generally positive for a nation’s currency as it reflects a growing economy, which is more likely to produce goods and services that can be exported, as well as attracting higher foreign investment. By the same token, when GDP falls it is usually negative for the currency.
When an economy grows people tend to spend more, which leads to inflation. The country’s central bank then has to put up interest rates to combat the inflation with the side effect of attracting more capital inflows from global investors, thus helping the local currency appreciate.
How does higher GDP impact the price of Gold?
When an economy grows and GDP is rising, people tend to spend more which leads to inflation. The country’s central bank then has to put up interest rates to combat the inflation. Higher interest rates are negative for Gold because they increase the opportunity-cost of holding Gold versus placing the money in a cash deposit account. Therefore, a higher GDP growth rate is usually a bearish factor for Gold price.
Author

Christian Borjon Valencia
FXStreet
Markets analyst, news editor, and trading instructor with over 14 years of experience across FX, commodities, US equity indices, and global macro markets.