Meta Platforms Inc.(META) Elliott Wave technical analysis [Video]
![Meta Platforms Inc.(META) Elliott Wave technical analysis [Video]](https://editorial.fxstreet.com/images/TechnicalAnalysis/ChartPatterns/Candlesticks/high-resolution-stock-exchange-evolution-panel-55741904_XtraLarge.jpg)
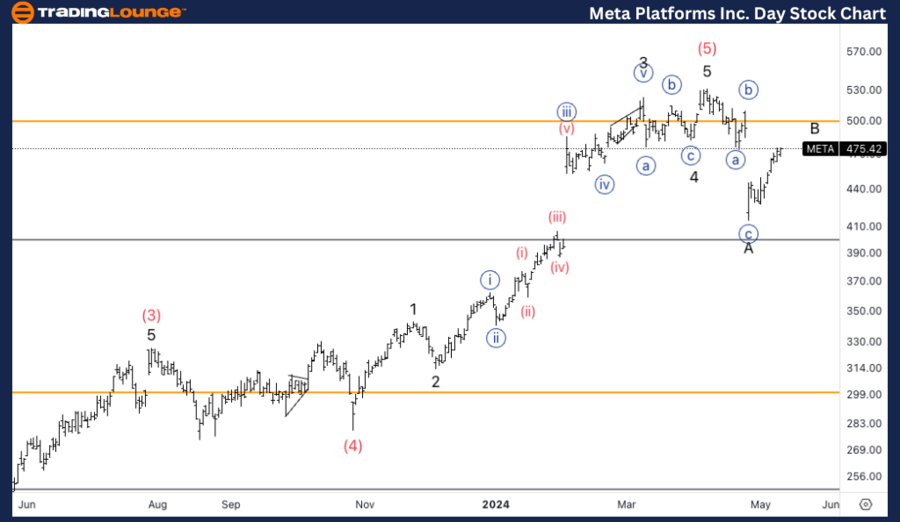
Meta Platforms Inc., (META) Daily Chart
META Elliott Wave technical analysis
Function: CounterTrend.
Mode: Corrective.
Structure: Flat.
Position: Intermediate (A).
Direction: Pullback in Minor B.
Details: We are showing two different counts in the Daily and 4H chart. Here we have a major top in place and we are looking for a larger correction to take place, looking for 500$ to provide resistance.
META Elliott Wave technical analysis – Daily chart
On the daily chart, META is categorized under a counter trend with a corrective flat structure, currently in the Intermediate wave (A) phase. The focus is on a significant pullback in the Minor B wave, suggesting a broader market correction. The analysis indicates a major top already in place, with a downward trajectory expected to continue. A resistance level at $500 is anticipated, which might cap any potential upside and confirm the bearish outlook.
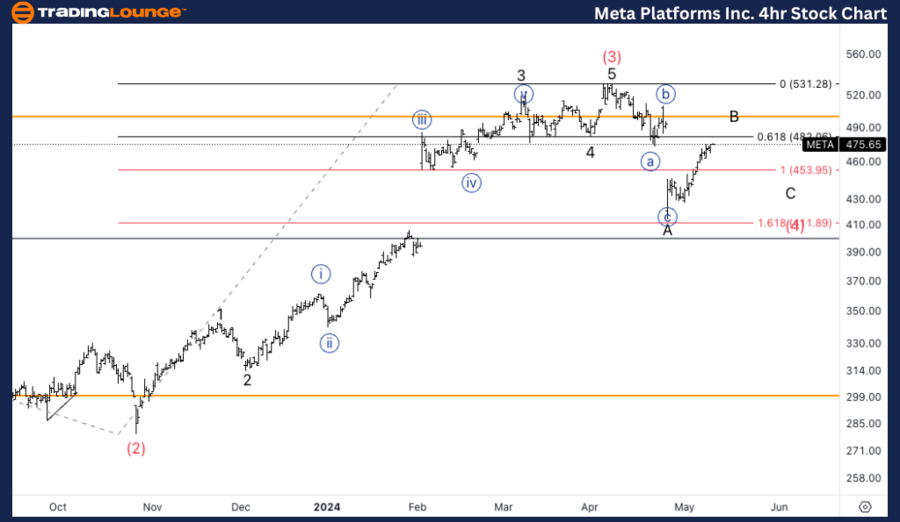
META Elliott Wave technical analysis – Four-hour chart
The 4-hour chart presents a more micro view, still within a counter trend but focusing on the smaller corrections within the overall structure. It is in the phase of Wave B or possibly in Wave (4), with a current top formation in Wave B. The equality between Wave (2) and Wave (4) is calculated to halt at $450, suggesting a shorter corrective phase than what is noted on the daily chart.
Function: Counter Trend.
Mode: Corrective.
Structure: Flat.
Position: Wave B or (4).
Direction: Topping in wave B.
Details: Here we are looking at a smaller correction, we have measured wave (2) and equality of (4) and (2) stop at 450$. Looking for sideways consolidation in (4) or else we could already have a bottom in place.
The Elliott Wave analysis for Meta Platforms Inc. (META) reveals a discrepancy between the daily and 4-hour chart interpretations as of May 10, 2024. Each chart provides a different perspective on the expected stock movements, catering to different trading strategies.
META Elliott Wave technical analysis [Video]
Author

Peter Mathers
TradingLounge
Peter Mathers started actively trading in 1982. He began his career at Hoei and Shoin, a Japanese futures trading company.


