Mastercard stock tests neckline support after head and shoulders breakdown

Mastercard Incorporated (MA), the global payments technology giant, has arrived at a technical inflection point on the charts after breaking down from a textbook head and shoulders topping pattern. Currently trading around $544.99, the stock has sliced through its neckline support near $525, raising questions about whether this payments leader can reclaim lost ground or if further weakness lies ahead.
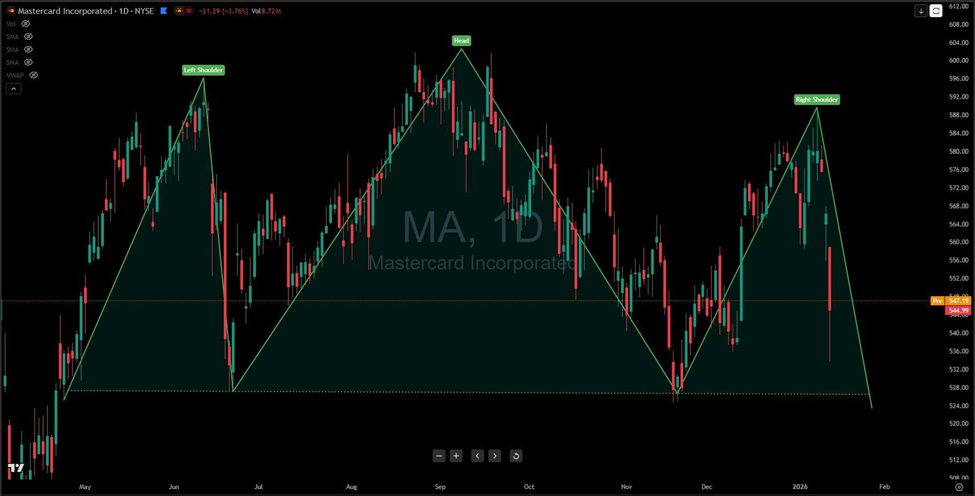
The pattern itself tells a compelling story of exhaustion. The left shoulder formed back in late June around $590, followed by a push to the head near $603 in late August—Mastercard's peak for this cycle. But that's where momentum started to fracture. The right shoulder in late December couldn't even match the left shoulder's height, topping out around $588. That failure to make a higher high is classic distribution behavior.
What makes this setup particularly noteworthy is how cleanly price respected the descending neckline throughout the pattern's formation. That green resistance trendline connecting the peaks acted like a ceiling that bulls couldn't penetrate. Now if we break through the horizontal neckline support, the question shifts from "if" to "how far."
For traders considering short positions, the measured move from this head and shoulders pattern projects downside toward the $450-$460 zone—roughly the height of the pattern subtracted from the neckline break. That's not next week's trade, but it's the target this structure implies. The rising support trendline from December might offer temporary relief, but broken necklines often become resistance on retests.
Bulls aren't completely out of options, though. A decisive bounce off of that $525 neckline with conviction would prevent the breakdown and suggest the pattern still could take longer to crack.
The beauty of technical analysis? Patterns like this don't care about quarterly earnings or payment volume growth. They simply reflect the collective psychology of millions of traders making decisions. And right now, that psychology has started to shift towards bearish for MA, the question is, can the bulls remain in charge.
Author

Benjamin Pool
Verified Investing
A seasoned financial expert with a passion for empowering individuals to mastering smart money management.


