Mastercard Inc. (MA) Elliott Wave technical analysis [Video]
![Mastercard Inc. (MA) Elliott Wave technical analysis [Video]](https://editorial.fxstreet.com/images/Markets/Equities/Industries/Software/software-code-637435356353853480_XtraLarge.jpg)
MA Elliott Wave technical analysis
Function: Trend.
Mode: Impulsive.
Structure: Motive.
Position: Minor wave 2.
Direction: Upside in 3 of (3).
Details: If the count is correct, we should expect a shallow 2, such as the one we potentially have right now, and continuation higher in what would be a third of a third which is often characterized by a strong impulsive look.
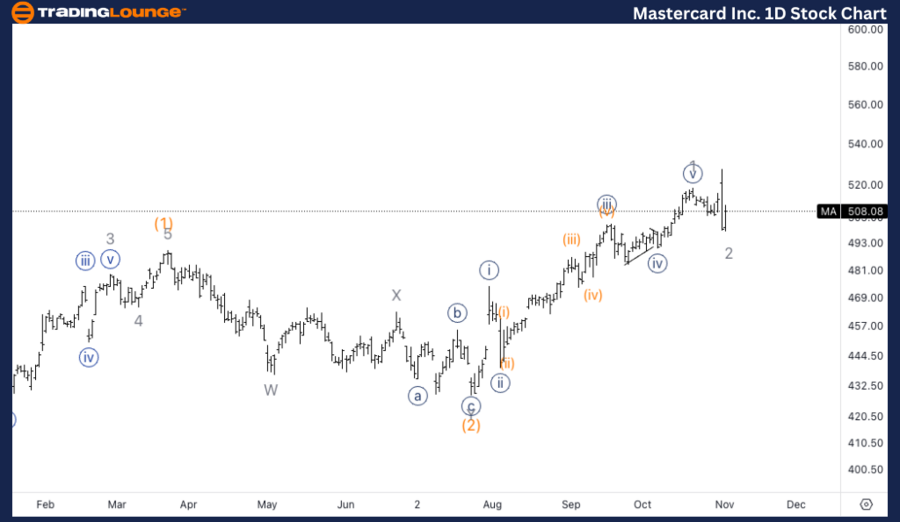
MA Elliott Wave technical analysis – Daily chart
The daily chart shows that Mastercard is likely in Minor wave 2 within a larger impulsive structure. If this count holds, the corrective phase should be shallow, allowing for a strong continuation higher in wave 3 of (3). Wave 3 of a third wave is often characterized by strong momentum, and further upside is anticipated from this point.
MA Elliott Wave technical analysis
Function: Trend
Mode: Impulsive
Structure: Motive
Position: Wave {i} of 3.
DIRECTION: Upside {i}.
DETAILS: Here’s the possible flat in wave 2 which found support on top of TradingLevel5 at 500$. As long as 500$ holds we should expect continuation higher.
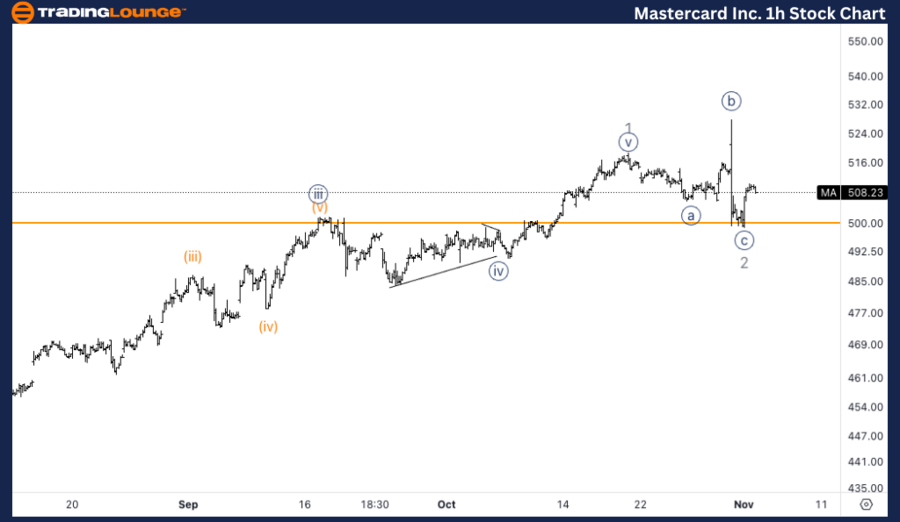
MA Elliott Wave technical analysis – One-hour chart
On the 1-hour chart, MA appears to have completed a flat correction in wave 2, with wave {i} now moving higher. Support was found at $500, which aligns with TradingLevel 5. As long as this support level holds, the expectation is for continued upside action in wave {iii}.
This Elliott Wave analysis for Mastercard Inc., (MA) examines both the daily and 1-hour charts to assess its current market trend, utilizing Elliott Wave Theory to anticipate potential future movements.
Mastercard Inc. (MA) Elliott Wave technical analysis [Video]
Author

Peter Mathers
TradingLounge
Peter Mathers started actively trading in 1982. He began his career at Hoei and Shoin, a Japanese futures trading company.


