|

MARA Holdings Inc. (MARA) Elliott Wave technical analysis [Video]

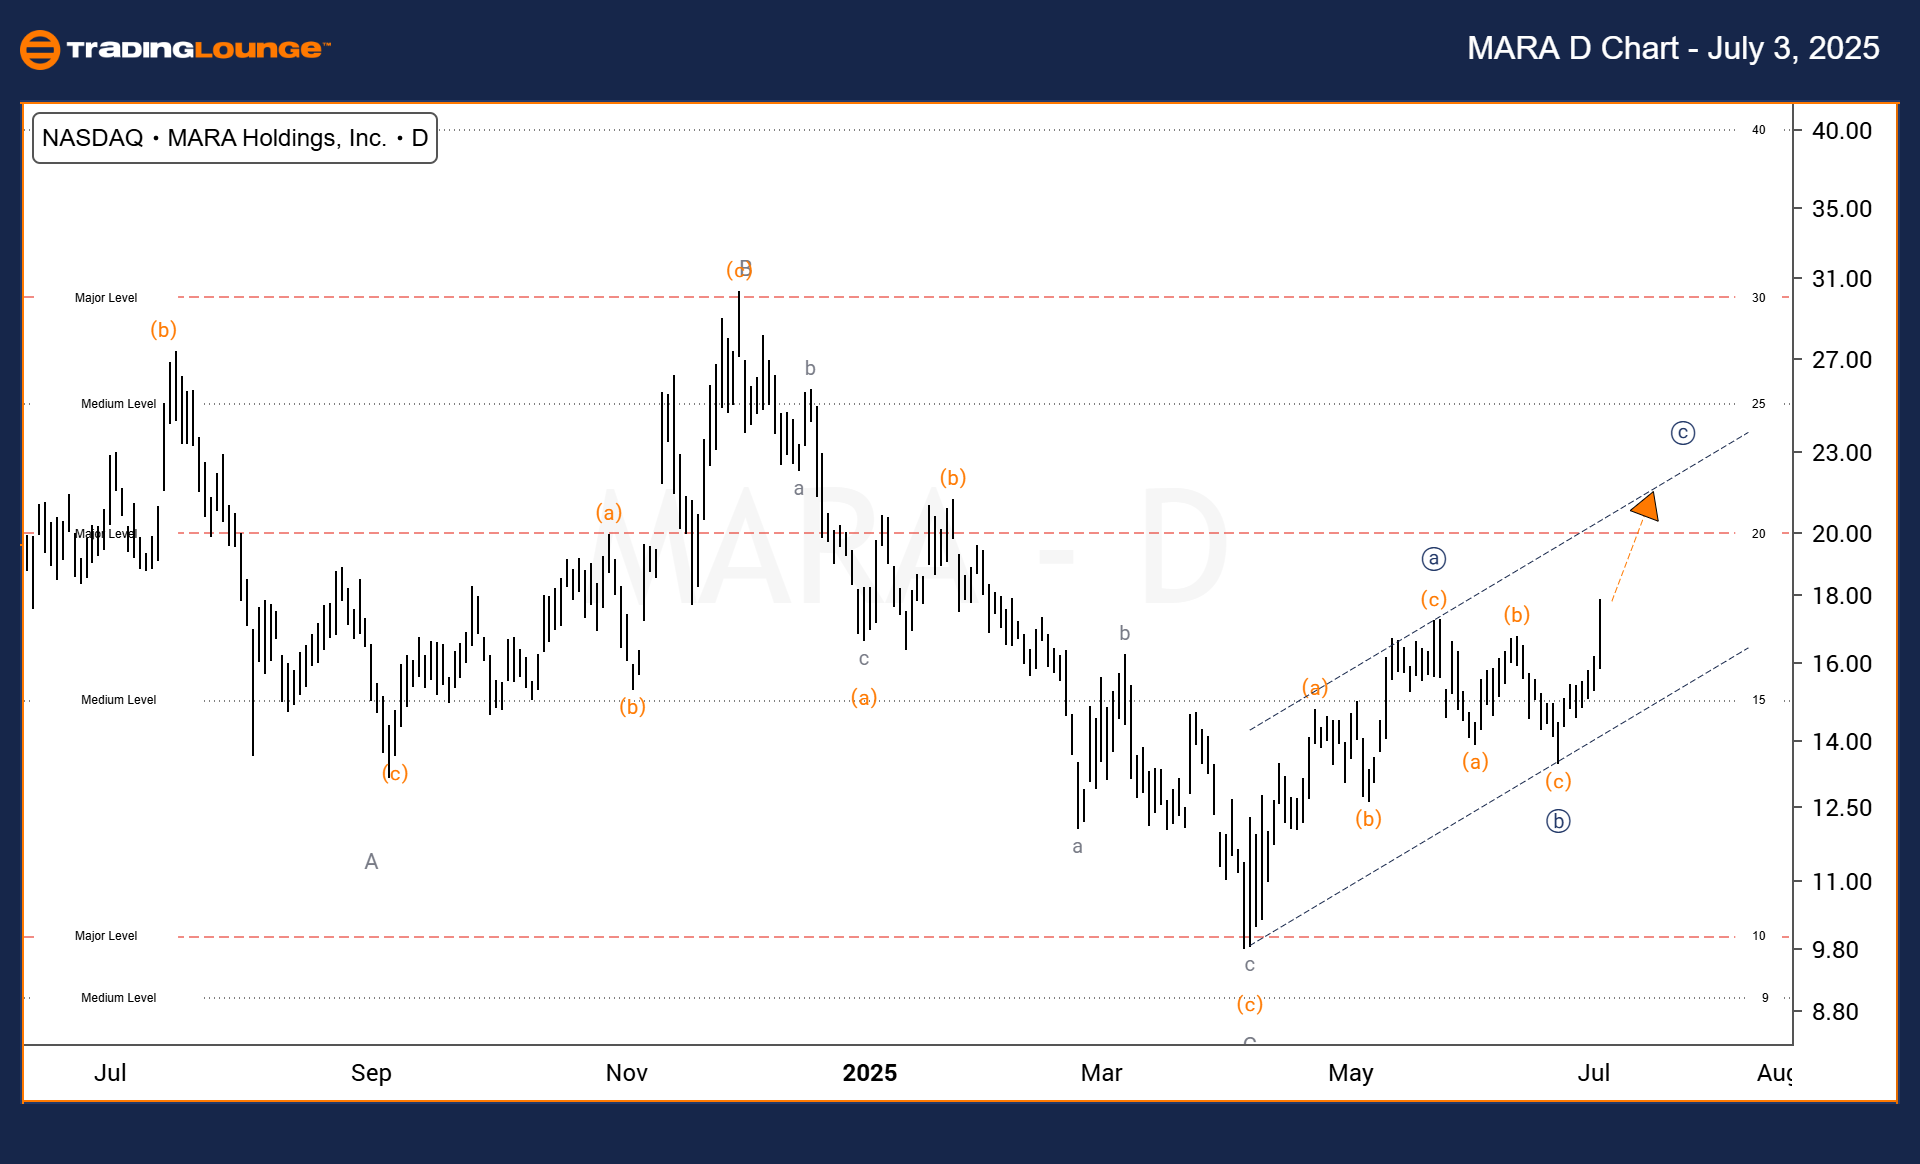
MARA Holdings, Inc (MARA) – Elliott Wave analysis – Daily chart

Function: Trend.

Mode: Corrective.

Structure: Corrective.

Position: Wave (a) of ©.

Direction: Upside in Wave (a).

Details: Expecting movement toward $20, then $23, signaling the final stage of Wave (a).

On the daily chart, MARA Holdings, Inc (MARA) is in the final phase of Wave (a) within the larger corrective structure ©. The price is approaching the $20 mark and is projected to move toward $23, suggesting the current segment of the correction is nearly complete. After Wave (a) concludes, Wave (b) is expected to follow, potentially offering a setup for short-term gains within the broader corrective cycle.

Chart

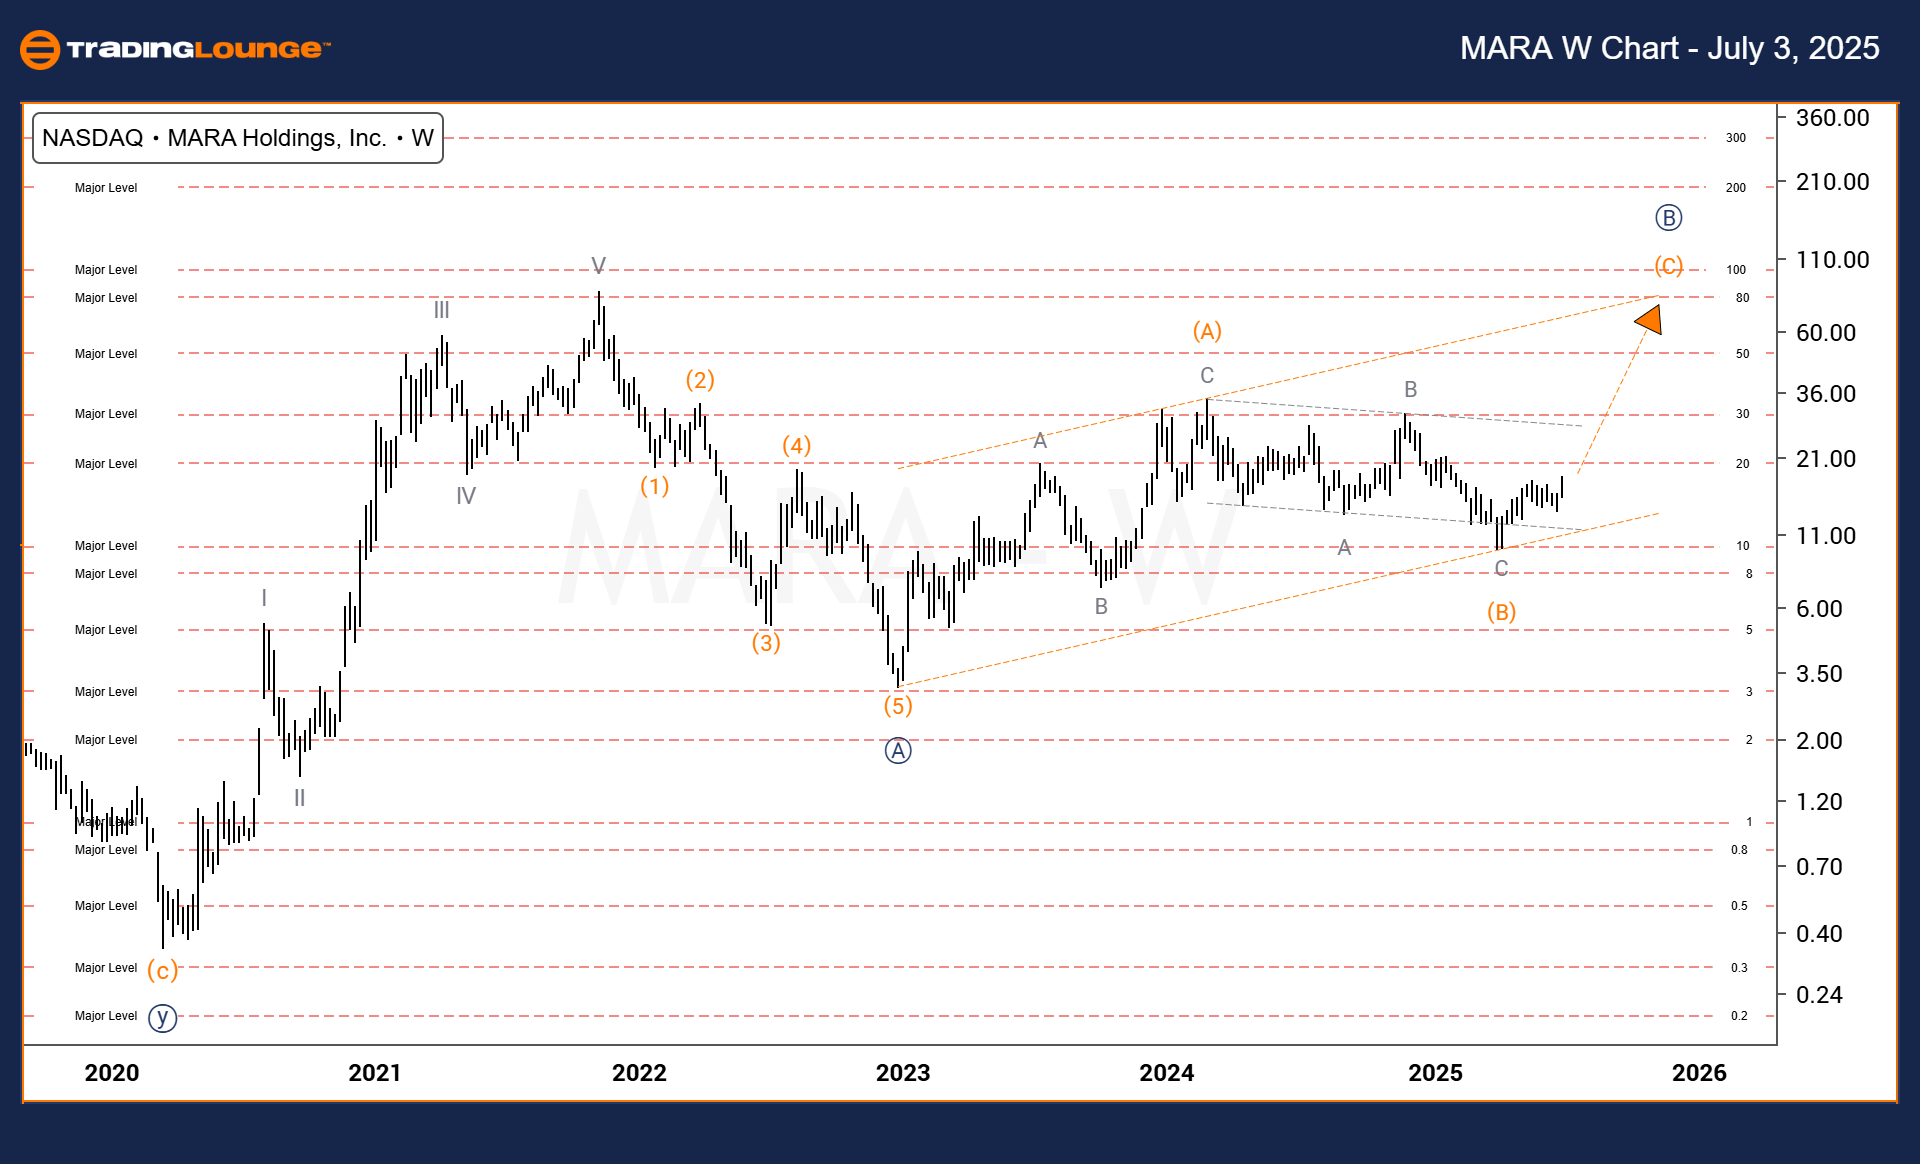
MARA Holdings, Inc (MARA) – Elliott Wave analysis –Weekly chart

Function: Counter Trend.

Mode: Corrective.

Structure: Corrective.

Position: Wave (C) of Ⓑ.

Direction: Upside into Wave (C).

Details: Wave (C) nearing maturity at upper parallel channel resistance.

In the weekly timeframe, MARA Holdings, Inc (MARA) shows a corrective trend moving into Wave (C) of Wave Ⓑ. The stock is testing the upper boundary of a parallel channel, indicating a possible short-term peak. Although the overall trend is upward, this resistance level might prompt a pause or consolidation phase before the next wave emerges. Traders should monitor price reactions at these levels to assess short-term risk and opportunities.

Chart

MARA Holdings Inc. (MARA) Elliott Wave technical analysis [Video]

Author

Peter Mathers

Peter Mathers

TradingLounge

Peter Mathers started actively trading in 1982. He began his career at Hoei and Shoin, a Japanese futures trading company.

More from Peter Mathers
Share:

Markets move fast. We move first.

Orange Juice Newsletter brings you expert driven insights - not headlines. Every day on your inbox.

By subscribing you agree to our Terms and conditions.

Editor's Picks

EUR/USD: Gains remain capped below 1.1800

EUR/USD consolidates its upside below 1.1800 in the European trading hours on Monday. The pair trades listlessly amid a tepid market mood, despite a broadly subdued US Dollar. Mid-tier US Pending Home Sales are next in focus. 

GBP/USD hovers around 1.3500 amid cautious markets

GBP/USD is oscillating around 1.3500 in the European session on Monday, supported by broad US Dollar softness. But the upside appears limited due to thin market conditions heading into the New Year holiday break. 

Gold corrects from record high as profit-taking sets in

Gold price retreats from a record high near $4,550 in European trading on Monday as traders book some profits ahead of holidays. If the US Dollar finds renewed demand, it could also weigh on the precious metal, as it makes Gold more expensive for non-US buyers.

Bitcoin, Ethereum, and XRP bulls regain strength

Bitcoin, Ethereum, and Ripple record roughly 3% gains on Monday, regaining strength mid-holiday season. Despite thin liquidity in the holiday season, BTC and major altcoins are regaining strength as US President Donald Trump pushes peace talks between Russia and Ukraine. The technical outlook for Bitcoin, Ethereum, and Ripple gradually shifts bullish as selling pressure wanes.

Economic outlook 2026-2027 in advanced countries: Solidity test

After a year marked by global economic resilience and ending on a note of optimism, 2026 looks promising and could be a year of solid economic performance. In our baseline scenario, we expect most of the supportive factors at work in 2025 to continue to play a role in 2026.

Avalanche struggles near $12 as Grayscale files updated form for ETF

Avalanche trades close to $12 by press time on Wednesday, extending the nearly 2% drop from the previous day. Grayscale filed an updated form to convert its Avalanche-focused Trust into an ETF with the US Securities and Exchange Commission.