Major market cycles aligning with key price targets

As we enter January, we have a series of very unusual long term cycles come together. Every few years we see long term cycles - monthly cycles align across a series of instruments. This is a rare occurrence and often portends a significant shift in economic conditions.
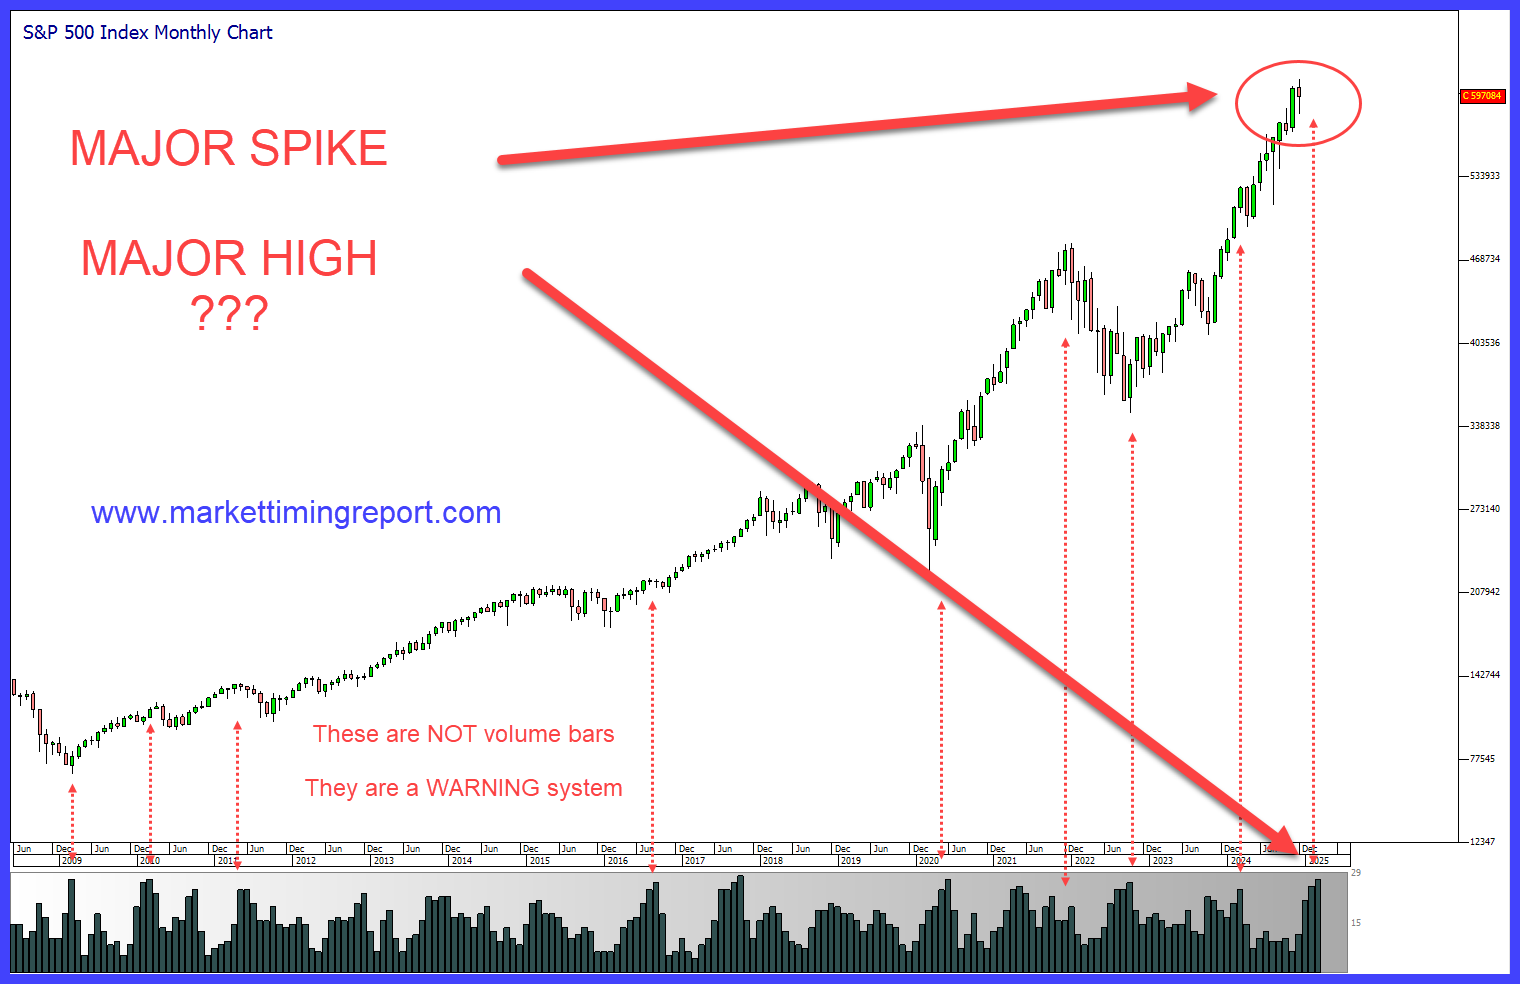
There are some potential incredible opportunities. Here is a major monthly spike in now on the US markets. It has been active in December and becomes stronger as we enter January.
So what exactly is this monthly spike?
Below this monthly chart of the S&P 500 index which heads back to 2008, you will see a series of histograms. When these histograms spike up, we can expect changes in trend. They are based on market cycles interacting at a high level. If you take a close look, you will see how previous spikes have aligned with significant turning points.
The key benefit of these histogram spikes is that they are predictive – in other words they are known in advance.
Most importantly, at this moment in time we have a very large spike in front of us.
Not only that, using traditional technical analysis and geometry, we can see that the S&P 500 index is very close to a significant price target.
At the bottom left you can also see such a spike identified the beginning off the bull market in 2009. Sentiment at that time was incredibly bearish with the world having lived through the global financial crisis.
Returning to the present market situation, we need to be on alert for some potential changes – potential major changes. The present bull market has effectively been running since 2009, following the end of the global financial crisis. With the exception of the short pullback back in early 2020 – the one that tied in with a 90 year cycle to within six weeks - most people under the age of 35, have not witnessed a proper bear market. That includes some of our professional portfolio manager friends at some of the large funds in the world. The purpose of these histograms and the whole timing system is to get the odds on your side. This spike is putting us on alert. It does not necessarily forecast a crash. Very rarely we can see an inversion and an acceleration.
Author

Andrew Pancholi
Market Timing Report
Andrew Pancholi is a world-renowned trading expert specializing in market timing.


