Lululemon Athletica Inc. Elliott Wave technical analysis [Video]
![Lululemon Athletica Inc. Elliott Wave technical analysis [Video]](https://editorial.fxsstatic.com/images/i/General-Stocks_1_XtraLarge.png)
LULU Elliott Wave Analysis Trading Lounge.
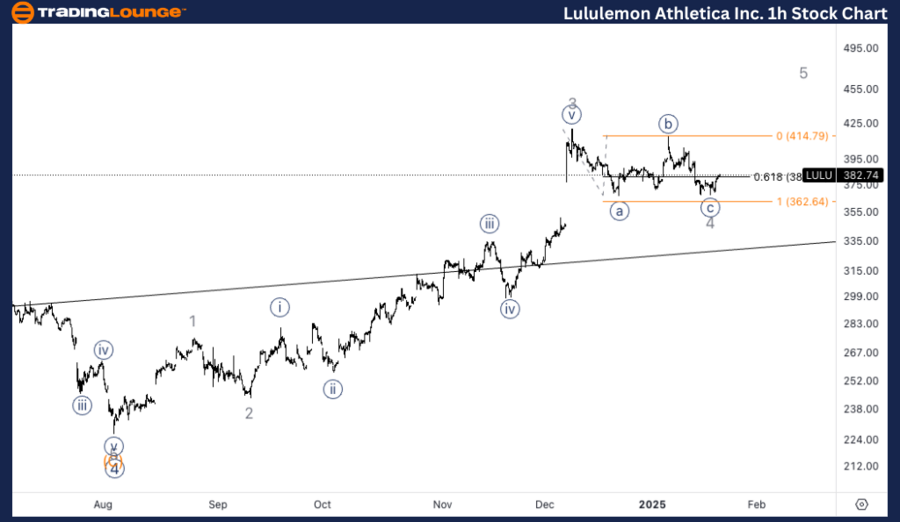
Lululemon athletica Inc., (LULU) Daily Chart.
LULU Elliott Wave technical analysis
Function: Counter Trend.
Mode: Corrective.
Structure: Zigzag.
Position: Wave 2 of (1).
Direction: Bottom in wave 2.
Details: We are looking for a potential bottom in wave 2 as we seem to have completed a wave {c}. Looking for further upside as we break out of 400$.
Lululemon athletica Inc., (LULU) 1H Chart.
LULU Elliott Wave Technical Analysis
Function: Counter Trend.
Mode: Corrective.
Structure: Zigzag.
Position: Wave {c} of 4.
Direction: Bottom in wave {c}.
Details: Here I present to you an alternative count suggesting we are in a wave 4 of (1) and the whole move up from August 2024 low is yet to be complete and we could see completion as we approach Trading Level 5 at 500$.
This Elliott Wave analysis of Lululemon athletica Inc., (LULU) outlines both the daily and 1-hour chart structures, highlighting the current trends and possible future price movements.
LULU Elliott Wave technical analysis – Daily chart
Lululemon (LULU) is showing signs of a potential bottom in wave 2 of a corrective Zigzag pattern. This suggests we may have completed wave {c}, setting the stage for further upside. A breakout above the $400 mark could confirm the start of a new bullish leg, as the stock looks to resume its upward trend.
LULU Elliott Wave technical analysis – One-hour chart
In this 1H chart of Lululemon (LULU), there’s an alternative count suggesting that we are currently in a wave 4 of (1), meaning the entire move up from the August 2024 low may still be unfolding. A potential completion of this move could occur as we approach the key Trading Level 5 at $500, where the stock might encounter resistance.
Technical analyst: Alessio Barretta.
LULU Elliott Wave Technical Analysis [Video]
Author

Peter Mathers
TradingLounge
Peter Mathers started actively trading in 1982. He began his career at Hoei and Shoin, a Japanese futures trading company.


