|

Light Crude Oil (CL) is targeting further declines in the near term [Video]

Light Crude Oil (CL) has exhibited a downward trajectory since reaching its high on January 16, 2025, with indications suggesting further declines ahead. The descent follows an incomplete bearish pattern, structured as a double three Elliott Wave formation. The initial decline, termed wave W, concluded at 65.22, followed by a recovery to 72.23, designated as wave X. The price has since resumed its downward movement in wave Y, characterized by a zigzag pattern.

Crude Oil 60 minutes Elliott Wave chart

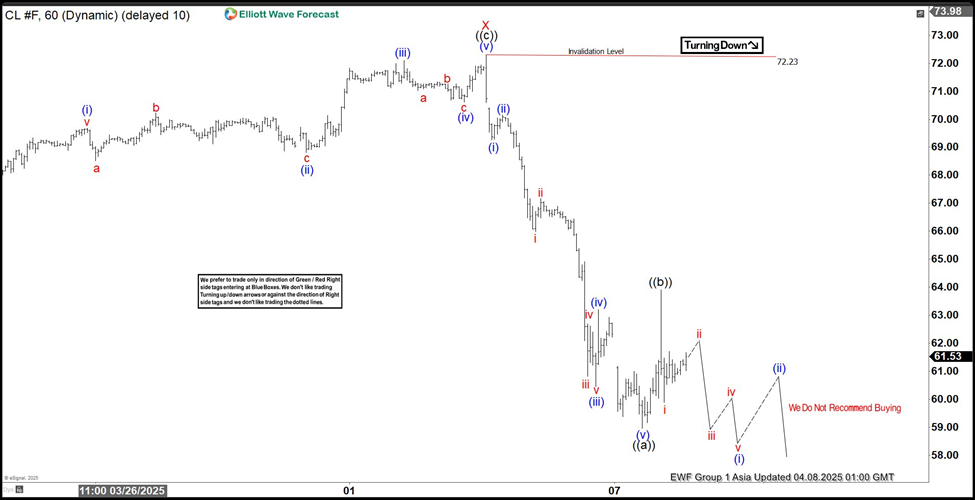
From the wave X peak of 72.23, the price fell to 69.27, marking the end of wave (i), then rose to 70.15 in wave (ii). The decline continued in wave (iii) to 60.45, followed by a recovery in wave (iv) to 63.20. The final segment, wave (v), concluded at 58.95, completing wave ((a)). A subsequent rise in wave ((b)) reached 63.90, after which the price resumed its descent in wave ((c)). For this downward trend to solidify, the price must fall below the 58.95 level established by wave ((a)). Otherwise, a potential stabilization or reversal remains possible. In the near term, as long as the 72.23 high remains intact, any upward movements are expected to lose momentum—potentially after 3, 7, or 11 incremental rises—leading to further declines.

Crude Oil (CL) [Video]

Author

Elliott Wave Forecast Team

Elliott Wave Forecast Team

ElliottWave-Forecast.com

More from Elliott Wave Forecast Team
Share:

Editor's Picks

EUR/USD seems fragile below 1.1700 as Middle East war boosts energy prices

The EUR/USD pair trades flat at around 1.1680 during the Asian trading session on Tuesday, but broadly seems vulnerable, being close to its five-week low. The major currency pair is under pressure as surging oil prices due to the United States-Israel war with Iran have increased the risks of higher inflation for the Old Continent.

GBP/USD hovers around 1.3400 with bearish pressure intact

GBP/USD edges higher after three days of losses, trading around 1.3400 during the Asian hours on Tuesday. The technical analysis of the daily chart indicates an ongoing bearish bias, as the pair trades within a descending channel pattern.

Gold sticks to gains above $5,350 amid sustained safe-haven demand; firmer USD caps gains

Gold sticks to its positive bias for the third straight day and trades above the $5,350 level heading into the European session on Tuesday. Concerns about a broader regional conflict in the Middle East continue to weigh on investors' sentiment and underpin demand for the traditional safe-haven bullion.

Top Crypto Gainers: Near Protocol, Virtuals Protocol, and Morpho lead market recovery

Near Protocol, Virtuals Protocol, and Morpho are leading the market recovery with double-digit gains over the last 24 hours. Technically, NEAR extends the breakout of the falling channel pattern, VIRTUAL holds above the 50-day EMA, while MORPHO tests a crucial resistance. 

The market is not panicking it is repricing the probability distribution of Oil and time

At the end of the day, markets do not trade morality or geopolitics. They trade transmission channels. And the only channel that truly matters in this maelstrom runs through the price of energy and the time value of money.

Grass 20% bullish breakout defies broader market weakness

Grass (GRASS) is edging up above $0.30 at the time of writing on Monday. The token’s notable 20% intraday surge stands out amid heightened volatility in the broader crypto market.