Larsen and Toubro Elliott Wave technical analysis {Video]
![Larsen and Toubro Elliott Wave technical analysis {Video]](https://editorial.fxstreet.com/images/Markets/Equities/Industries/HealthCare/pic-doctor-hands-637435350842016741_XtraLarge.jpg)
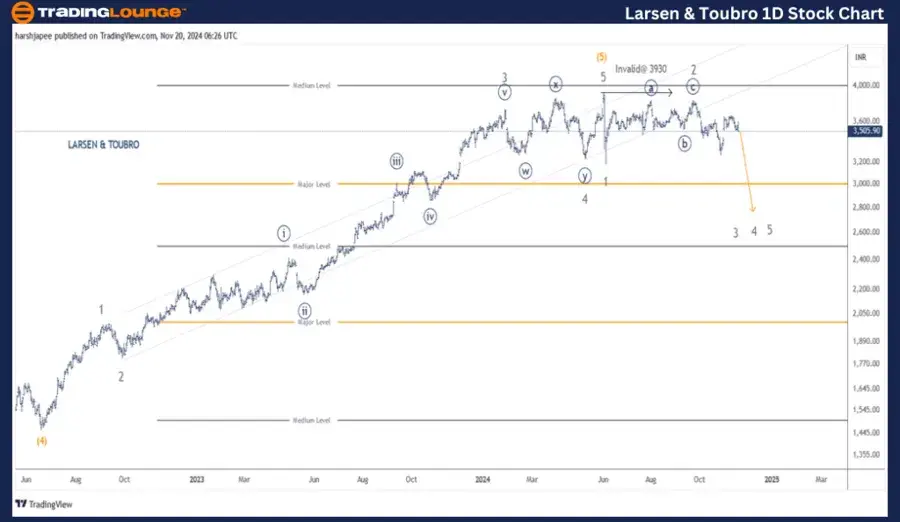
Larsen and Toubro – LT (one-day chart) Elliott Wave technical analysis
Function: Counter Trend (Intermediate degree, orange).
Mode: Corrective.
Structure: Impulse, within larger degree Wave (A).
Position: Minor Wave 3 Grey.
Details: Minor Wave 3 Grey is now progressing lower against 3930 and it could be extending.
Invalidation point: 3930.
LARSEN & TOUBRO Daily Chart Technical Analysis and potential Elliott Wave Counts:
LARSEN & TOUBRO daily chart is indicating that larger degree trend higher is complete around 3930 high and prices have potentially reversed lower. A Minor degree corrective structure might be unfolding against 3930 and only a break higher would nullify.
Earlier, the stock terminated Intermediate Wave (4) Orange around 1475 lows in January 2022. The religious rally thereafter can be sub divided into five waves Minor Wave 1 through 5 through 3930 mark. Also note Wave 2 was sharp, while Wave 4 turned out to be a combination.
Ideally, a counter trend is now unfolding against 3930 high as bears prepare to remain in control, going forward.
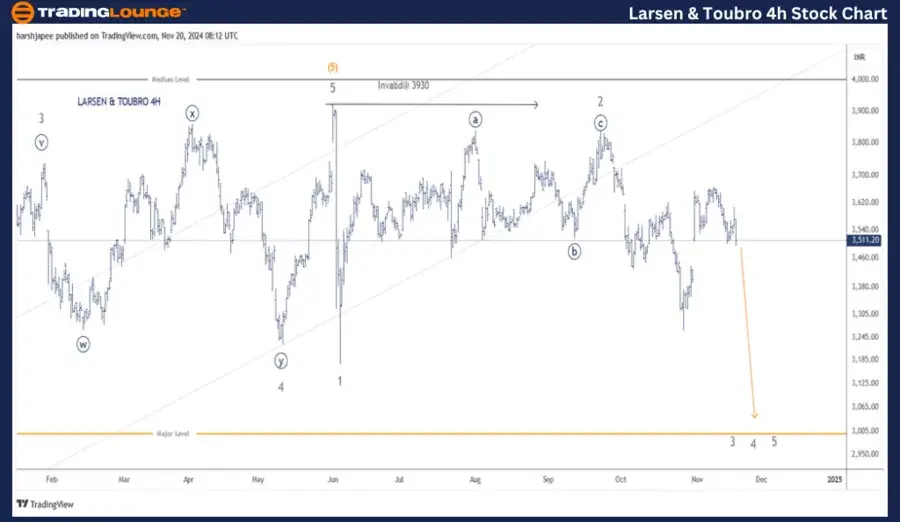
Larsen and Toubro – LT (four-hours chart) Elliott Wave technical analysis
Function: Counter Trend (Intermediate degree, orange).
Mode: Corrective.
Structure: Impulse, within larger degree Wave (A).
Position: Minor Wave 3 Grey.
Details: Minor Wave 3 Grey is now progressing lower against 3930 and it could be extending. A break below 3270 will accelerate further.
Invalidation point: 3930.
LARSEN & TOUBRO 4H Chart Technical Analysis and potential Elliott Wave Counts:
LARSEN & TOUBRO 4H chart highlights the sub waves since termination of Minor Wave 3 Grey around 3740-45 range. Please note that Minor Wave 4 unfolded as a combination ((w))-((x))-((y)), terminating around 3230 mark.
Minor Wave 5 Grey was an impulse rallying through 3930 mark before prices reversed sharply to break below 3230, marked as Minor Wave 1 Grey. Wave 2 could be labelled as flat terminating around 3845 mark. If the above holds, Wave 3 is now underway against 3845 high.
Conclusion:
LARSEN & TOUBRO is progressing lower towards 3150 mark at least, in the near term. Ideally, prices should stay below 3930 high to keep the bearish structure intact.
Elliott Wave analyst: Harsh Japee.
Larsen and Toubro – LT Elliott Wave technical analysis [Video]
Author

Peter Mathers
TradingLounge
Peter Mathers started actively trading in 1982. He began his career at Hoei and Shoin, a Japanese futures trading company.


