|

Kiwi extends backslide from recent high, opens the way up to 0.6100

  • The Kiwi has seen two consecutive down days, pulling the NZD down from 0.6200.
  • Market risk appetite has turned south this week, pushing investors into safe havens.
  • Investor focus squarely on US data this week with NFP in the pipe.

The NZD/USD heads into the Wednesday market session struggling near the 0.6130 level as the kiwi (NZD) locks in two consecutive days of declines against the US Dollar (USD).

Market sentiment soured early Tuesday after Moody’s downgraded China’s sovereign debt outlook, with the ratings agency citing the Chinese government’s looming expenses should China need to start bailing out beleaguered local governments and drowning state-owned agencies.

US data came in mixed on Tuesday, with the Institute for Supply Management’s Services Purchasing Managers’ Index (PMI) came in at 52.7 for the annualized period into November, compared to the median market forecast of 52, and the Services sector PMI showed a step up from October’s 51.8.

US JOLTS Jobs Openings showed still-tightening labor market conditions with the report printing 8.733 million job postings, a two-and-a-half-year low and undercutting the previous month’s 9.35 million (revised down slightly from 9.553 million).

With a still-tight labor market weighing down investors hopes for a sooner-rather-than-later Federal Reserve rate cut cycle, market sentiment has knocked back on multiple fronts, sending the US Dollar higher against most major currencies heading into the midweek.

Wednesday brings US ADP Employment Change, and Friday will close the trading week out with another round of the US’ Nonfarm Payrolls (NFP); both labor indicators are expected to show improving employment conditions and a still-tightening labor market. The ADP Employment Change is expected to print at 130K in November compared to the previous 113K, while the NFP is forecast to come in at 185K vs October’s 150K.

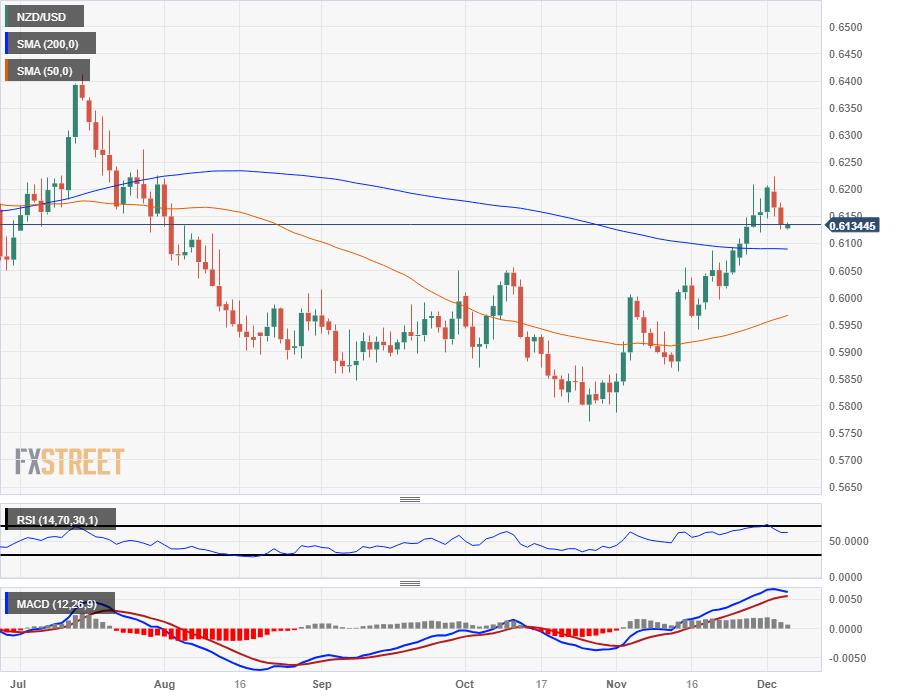
NZD/USD Technical Outlook

The Kiwi has backslid straight into the 200-hour Simple Moving Average (SMA) near 0.6130, and intraday price action is set to get hung up near the price level with exposure risk tilting firmly to the downside as the 50-hour SMA turns bearish into 0.6160, capping off upside bids.

Daily candlesticks have the NZD/USD is set to confirm a bearish pullback to the 200-day SMA just below 0.6100, and Monday’s four-month peak just below 0.6225 represents the nearest technical ceiling for near-term bids.

NZD/USD Daily Chart

NZD/USD Technical Levels

NZD/USD

Overview
Today last price0.6133
Today Daily Change-0.0033
Today Daily Change %-0.54
Today daily open0.6166
 
Trends
Daily SMA200.6033
Daily SMA500.5959
Daily SMA1000.5985
Daily SMA2000.609
 
Levels
Previous Daily High0.6223
Previous Daily Low0.615
Previous Weekly High0.6208
Previous Weekly Low0.606
Previous Monthly High0.6208
Previous Monthly Low0.5788
Daily Fibonacci 38.2%0.6178
Daily Fibonacci 61.8%0.6195
Daily Pivot Point S10.6137
Daily Pivot Point S20.6107
Daily Pivot Point S30.6064
Daily Pivot Point R10.621
Daily Pivot Point R20.6253
Daily Pivot Point R30.6283

Author

Joshua Gibson

Joshua joins the FXStreet team as an Economics and Finance double major from Vancouver Island University with twelve years' experience as an independent trader focusing on technical analysis.

More from Joshua Gibson
Share:

Markets move fast. We move first.

Orange Juice Newsletter brings you expert driven insights - not headlines. Every day on your inbox.

By subscribing you agree to our Terms and conditions.

Editor's Picks

EUR/USD posts modest gains near 1.1650 amid Fed rate cut bets

The EUR/USD pair posts modest gains around 1.1645 during the early Asian session on Monday. The prospect of a US Federal Reserve rate cut at its December meeting on Wednesday could weigh on the US Dollar against the Euro. Later on Monday, the German Industrial Production and Eurozone Sentix Investor Confidence reports will be published. 

GBP/USD consolidates around 1.3330 as traders await Fed rate decision

The GBP/USD pair kicks off the new week on a subdued note and oscillates in a narrow trading band, around the 1.3320-1.3325 region, during the Asian session. Spot prices, however, remain close to the highest level since October 22, touched last Thursday, with bulls awaiting a sustained strength and acceptance above the 100-day Simple Moving Average before placing fresh bets.

Gold continues its struggles with $4,200 as the Fed week kicks in

Gold treads water around $4,200 early Monday, while within the previous week’s trading range. US Dollar holds lower ground amid looming Fed rate cut call and a cautious mood. Gold’s daily technical setup suggests that buyers are not ready to give up yet.

Top Crypto Losers: Monero extends losses below $370 as Aster and Bonk risk record lows

Altcoins, including Monero, Aster, and Bonk, are at risk of extending their losses as the broader cryptocurrency market stalls amid the dragging peace talks between Ukraine and Russia. 

The Silver disconnection is real

Silver just hit a new all-time high. Neither did gold, nor mining stocks. They all reversed on an intraday basis, but silver’s move to new highs makes it still bullish overall, while the almost complete reversals in gold and miners make the latter technically bearish.

Ripple faces persistent bear risks, shrugging off ETF inflows

Ripple is extending its decline for the second consecutive day, trading at $2.06 at the time of writing on Friday. Sentiment surrounding the cross-border remittance token continues to lag despite steady inflows into XRP spot ETFs.