JPMorgan (JPM) shares are not ready for a pullback

JPMorgan Chase & Co. (JPM) is an American multinational investment bank and financial services holding company headquartered in New York City and incorporated in Delaware. As of December 31, 2021, JPMorgan Chase is the largest bank in the United States, the world’s largest bank by market capitalization, and the fifth-largest bank in the world in terms of total assets, with total assets totaling to US$3.831 trillion.
JPM daily chart January 2023
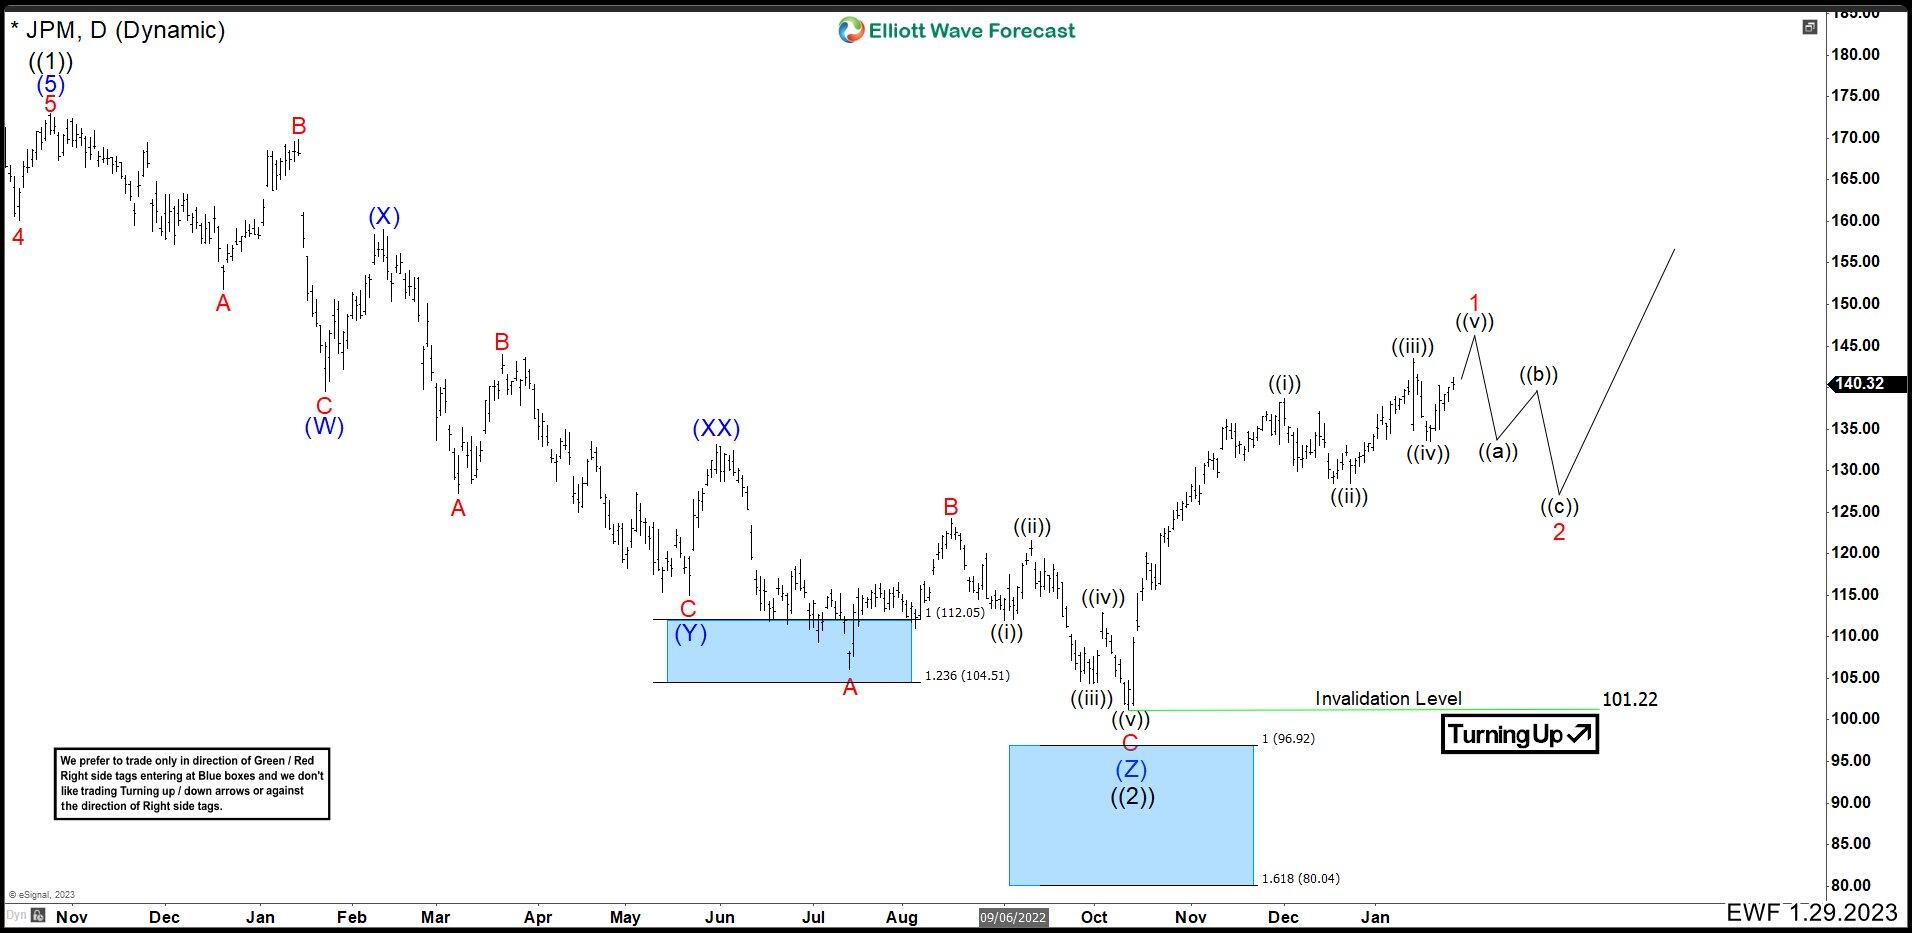
Months ago, we thought the possibility that JPM could build a leading diagonal from 101.22 low. In that case, wave 1 had not been finished yet and with a further high it would complete wave 1. Also we believed that this should happen in the next month of February. If we would make one more high and then breaking the low of the wave ((iv)), most likely it would be doing the structure shown.
JPM daily chart June 2023
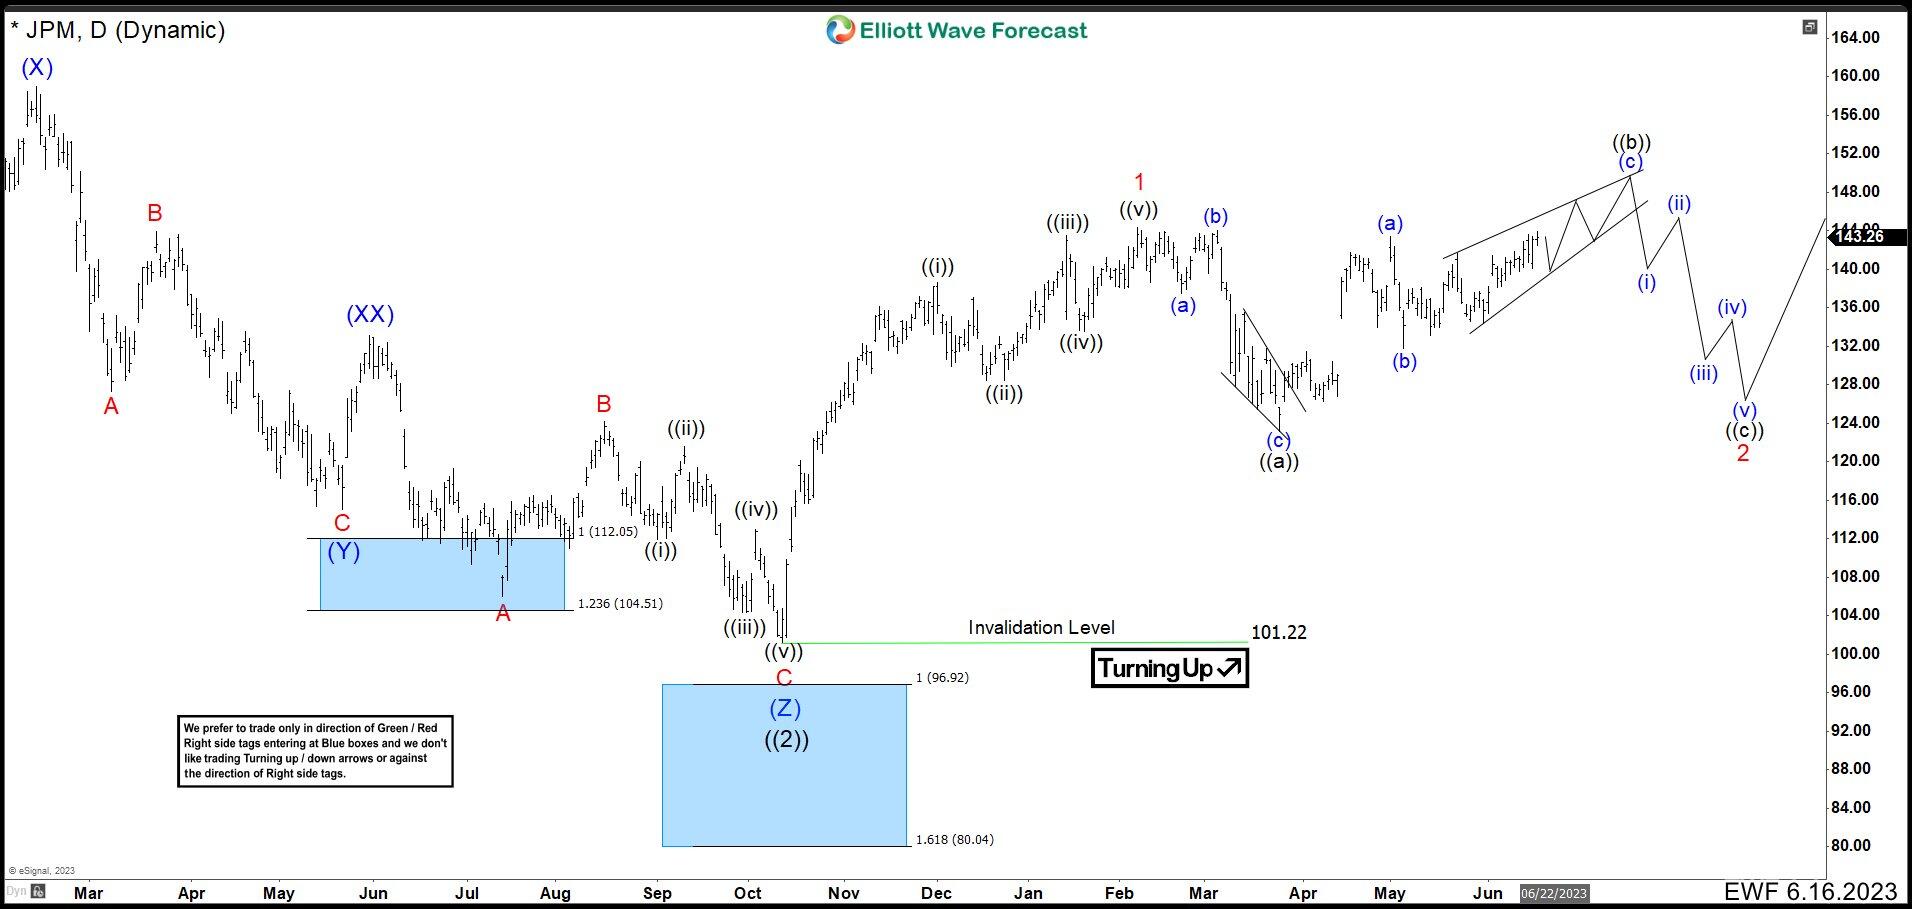
In the chart above, we can see how JPM built 5 waves higher to end the leading diagonal at $144.34 and the wave 1. Then, it developed a flat correction 3-3-5, where wave ((c)) was a clear ending diagonal to finish wave 2 at $123.11. Short term, price action has rally and it made an impulse wave (i) ending at $143.48 and wave (ii) pullback ended at $131.81. After this, the market continued to the upside and actually has broken above $143.28. It should continue with this trend until completing another impulse as wave ((i)) before seeing 3, 7 or 11 swings correction as wave ((ii)). This view is valid while the price of $123.11 is intact.
JPM daily chart June 2023 alternative
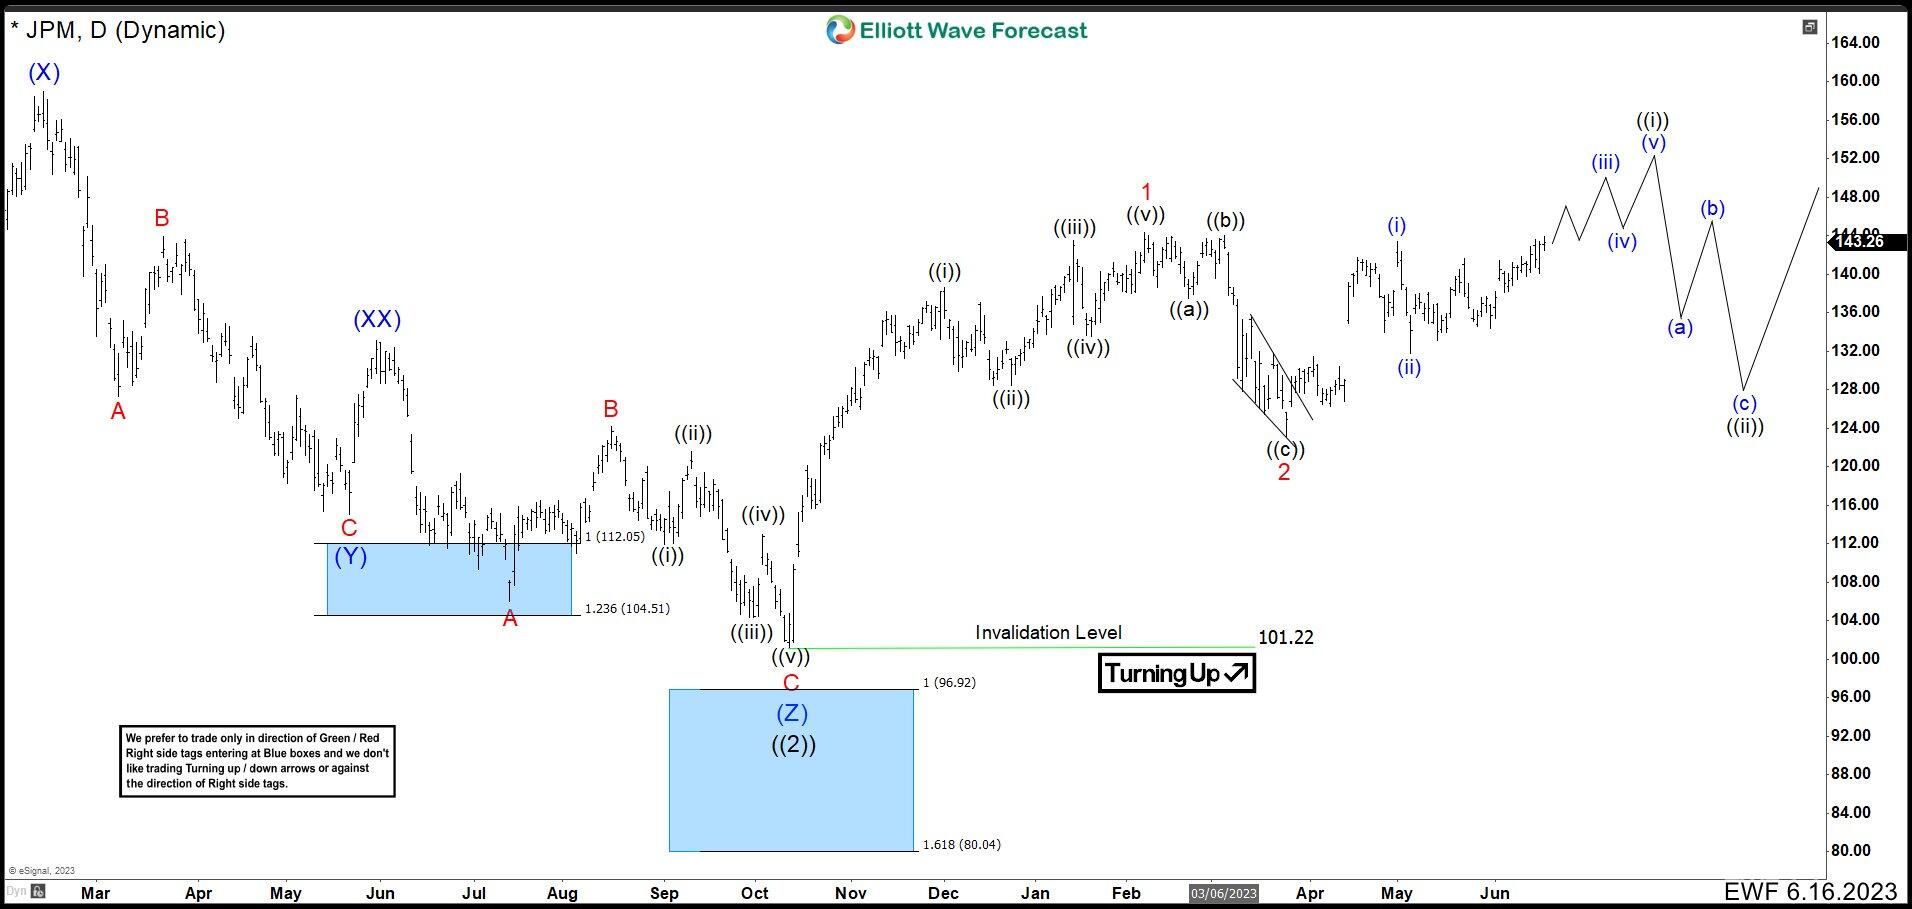
In this alternative, we can see that is the same path, but different structure. We are forecasting a flat correction as wave 2. That means, the flat structure started from wave 1 high ended just a wave ((a)) at $123.11 and currently, JPM is making 3 waves higher as wave ((b)). In this case, we can calculate the possible ending of wave ((b)) which it could be in $149.70 – $152.13 area. If we have a reaction lower around that area, then the market should turn lower and develop an impulse structure to complete wave ((c)) of 2 and wave 2 before rally again.
Author

Elliott Wave Forecast Team
ElliottWave-Forecast.com


