Johnson & Johnson (JNJ Stock) should continue with the rally this week after rebounce

Since the crash of March 2020, all stocks have tried to recover what they lost and JNJ was no exception. Johnson & Johnson did not only recover the lost, but It also reached historic highs. Now, we are going to try to build a wedge from the March 2020 lows with a target above $176.
JNJ last daily chart
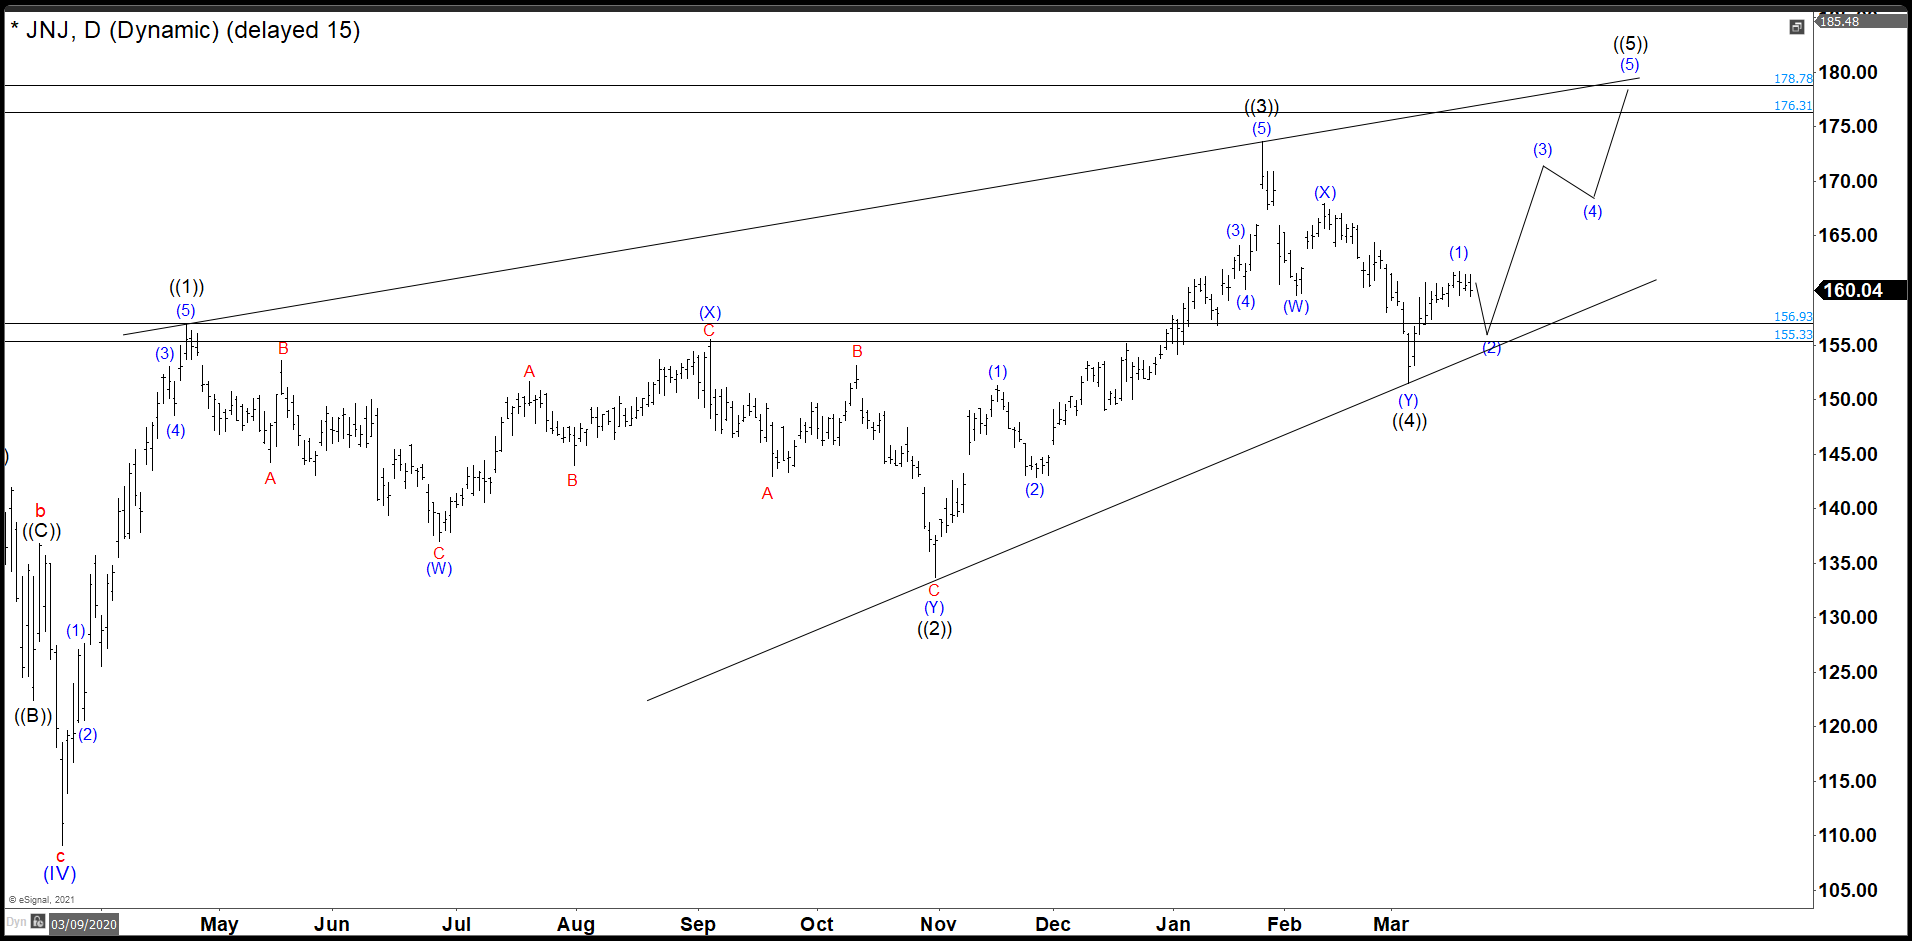
In the last chart we can clearly see that after the fall of March 2020, JNJ had a strong and rapid recovery. This wave ((3)) had its highest point at 173.69 where JNJ was rejected by the market. This rejection did another double correction structure and overlaps the wave ((1)) zone to end the wave ((4)). (If you want to learn more about Elliott Wave Theory, please follow this link: Elliott Wave Theory).
JNJ daily chart
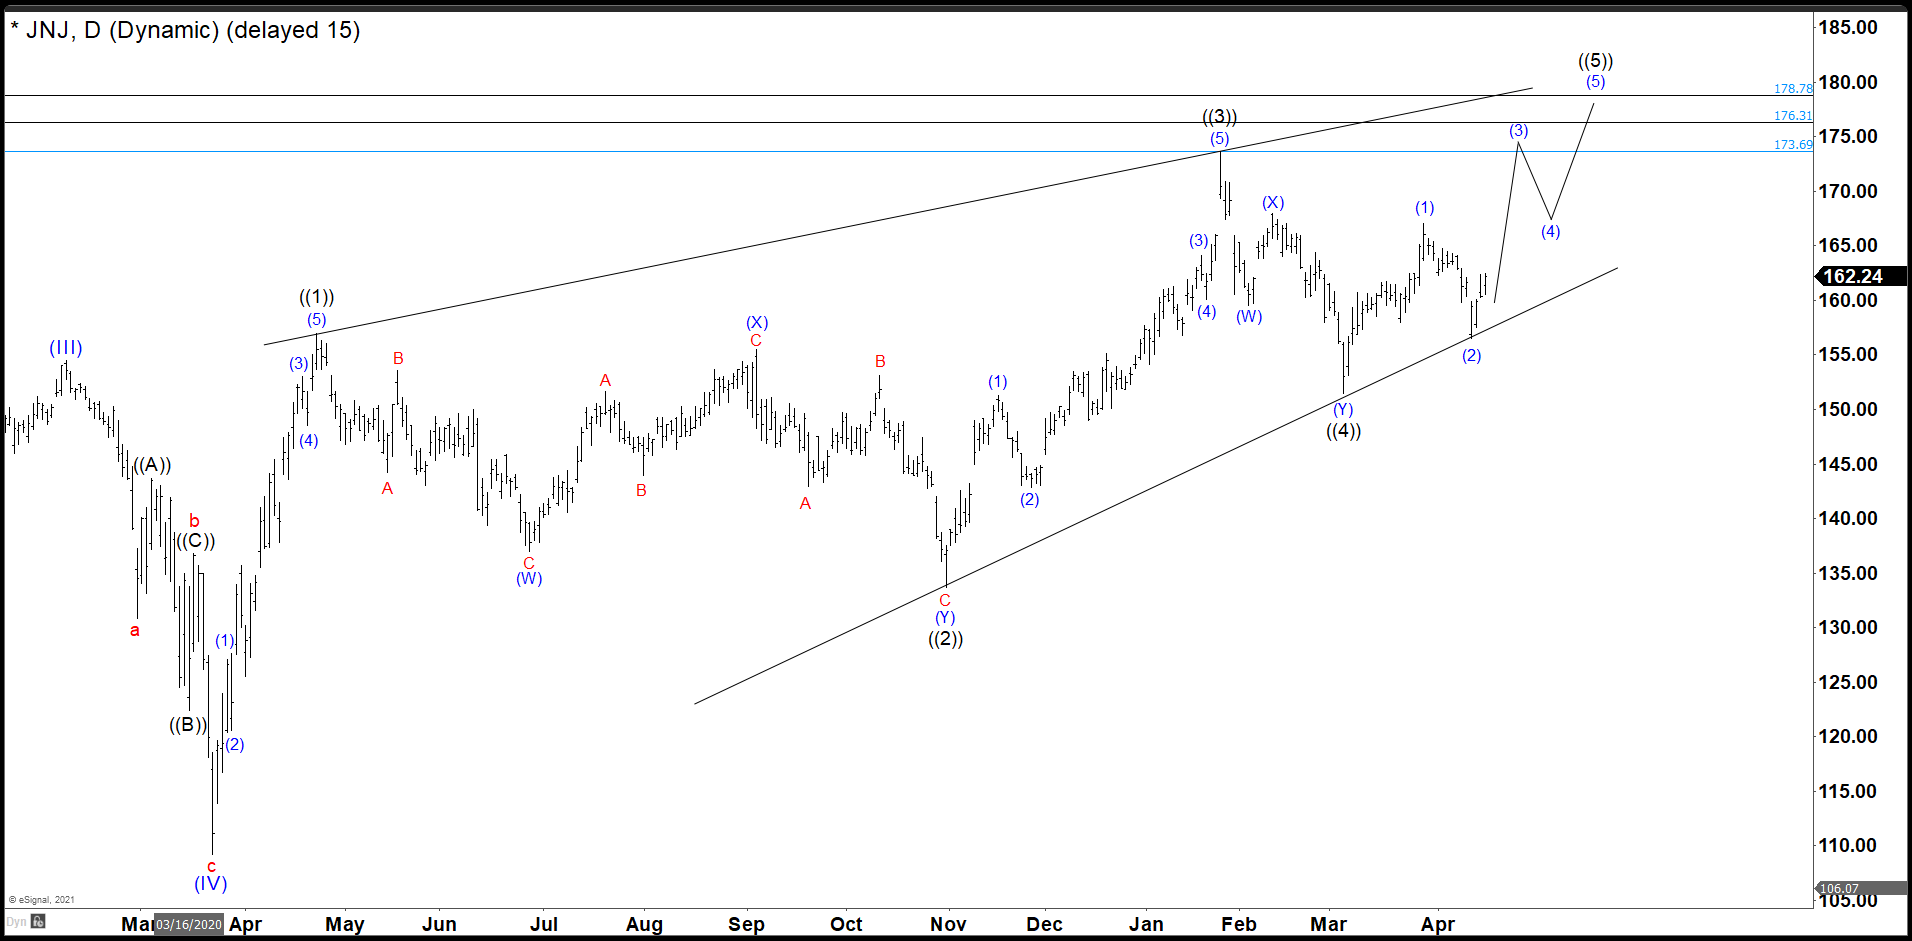
As days passed, the share price continued to rise until reaching 167.12, which we call wave (i). From there, we have a clear correction in a zigzag structure as wave (2) that bounced from a possible trendline. If this trendlineis good, then JNJ should continue to rise with an impulse structure that exceeds at least the value of $ 173.69 in the following days.
Premium
You have reached your limit of 3 free articles for this month.
Start your subscription and get access to all our original articles.
Author

Elliott Wave Forecast Team
ElliottWave-Forecast.com


