Johnson & Johnson ( JNJ Stock) Q4 outlook: EPS to continue crowning above consensus estimates?

The healthcare bellwether Johnson & Johnson (NYSE: JNJ) is scheduled to report its fiscal results for the fourth quarter and full-year 2020 on 26th January (Tuesday) before market open.
Being one of the largest healthcare companies for more than 130 years, JNJ has built a diversified business model concentrating in three major areas: pharmaceutical, medical devices and consumer, which have supported the company to withstand unfavorable economic cycles and to grow financially.
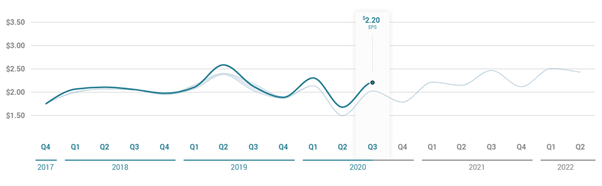
Figure 1: Johnson & Johnson Earnings Estimates and Actuals by Quarter, year 2017-20.
In fact, the company has never failed to deliver impressive earnings performance for over a decade, with reported EPS topping the consensus estimates at all times. In its latest quarterly earnings report, JNJ reported a healthy growth in sales and adjusted EPS, by 1.7% y/y and 3.8% y/y respectively, to a recorded $21.1 billion (previously was $20.7 billion) and $2.20 (previously was $2.12). Such results were mainly driven by robust underlying business fundamentals of the company. The financial wellbeing of the company was further demonstrated from the event that its Board of Directors has declared a cash dividend payout to its shareholders in early January this year. The dividend is payable on March 9, 2021.
In the upcoming earnings announcement, based on Zacks Consensus Estimates, the company is expected to report an increase in sales revenue by 4.19% y/y to $21.62 billion. There is a slight downgrade in EPS estimation, by 3.72% y/y to $1.81/share. In general, the ability of the company to perform well above analysts’ expectations has been clearly reflected through the percentage difference between the actual reported quarterly EPS and estimated quarterly EPS, in short, the EPS surprise, as shown below:
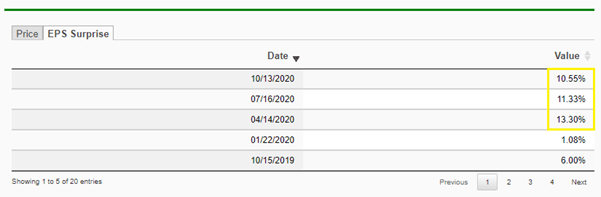
Table 1: Johnson & Johnson EPS Surprise. Source intercepted from
As shown in table 1 above, the EPS surprise of JNJ for the past three quarters stood at 11.73% on average,illustrating the company’s ability to withstand the pandemic shock.
As we mentioned in our previous article, market participants are currently waiting for the interim efficacy data from the company’s study on its single-dose COVID-19 vaccine candidate, the results of which are likely to be revealed on the investor call. A positive outcome may generate a surge in market demand given the uniqueness of the vaccine that herd immunity can be achieved with just a single shot. In addition, JNJ may also benefit from the COVAX program that it has participated in which is aimed at delivering vaccine doses to low- and middle-income countries. It is reported that there was an agreement made between the two parties that JNJ shall supply 500 million doses of its single-dose vaccines.
Considering the solid background of JNJ and the potential of the company to reap fruitful revenue from its vaccines, a Strong Buy consensus is found among Wall Street analysts, with an average price target being set at $177.00.
Technical Analysis
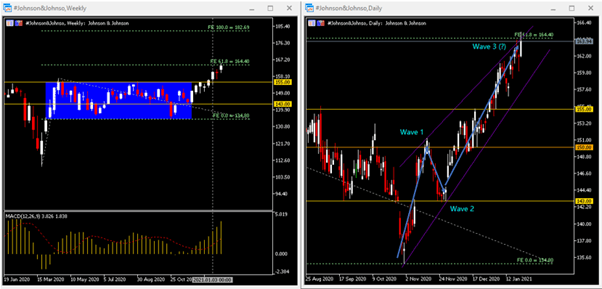
The Weekly chart shows that the #Johnson&Johnson share price had a successful breakout above key resistance $155.00 in the first trading week of 2021. The MACD indicator remains aligned above the neutral line. On the contrary, the Daily chart has shown that the company’s share price is being traded within an ascending wedge. Within the pattern, first technical correction was seen in mid-November before the share price found its support again above $143.00. The whole retracement process bridged the formation of Wave 1–2. The share price saw bullish gains since its rebound from $143.00, until recently when it met resistance at $164.50, which also corresponds to the 61.8 Fibonacci Expansion level.
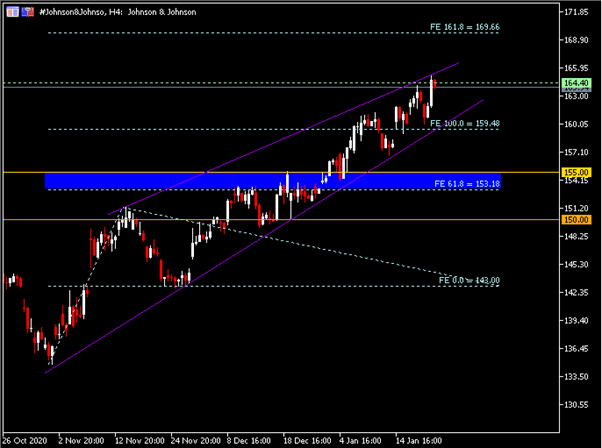
From the 4-Hourly chart above, $164.50 and the upper trend line of ascending wedge is the nearest resistance zone to watch. If bullish breakout is successful, the next two important Resistance levels to focus on are $170.00 (FE 161.8 in H4) and $182.50 (FE 100.0 in W1).
However, if current share price fails to break above the said Resistance, another round of technical correction may be plausible, thus completing wave 3–4. The nearest Support zone lies at $159.50 and lower trend line of ascending wedge. S2 and S3 are found at $153.00-$155.00 and $150.00, respectively.
Premium
You have reached your limit of 3 free articles for this month.
Start your subscription and get access to all our original articles.


