|

Johnson & Johnson (JNJ) shares are entering in a bull trap

Johnson & Johnson (JNJ) is an American multinational corporation founded in 1886 that develops medical devices, pharmaceuticals, and consumer packaged goods. Its common stock is a component of the Dow Jones Industrial Average, and the company is ranked No. 36 on the 2021 Fortune 500 list of the largest United States corporations by total revenue.

JNJ January 2023 daily chart

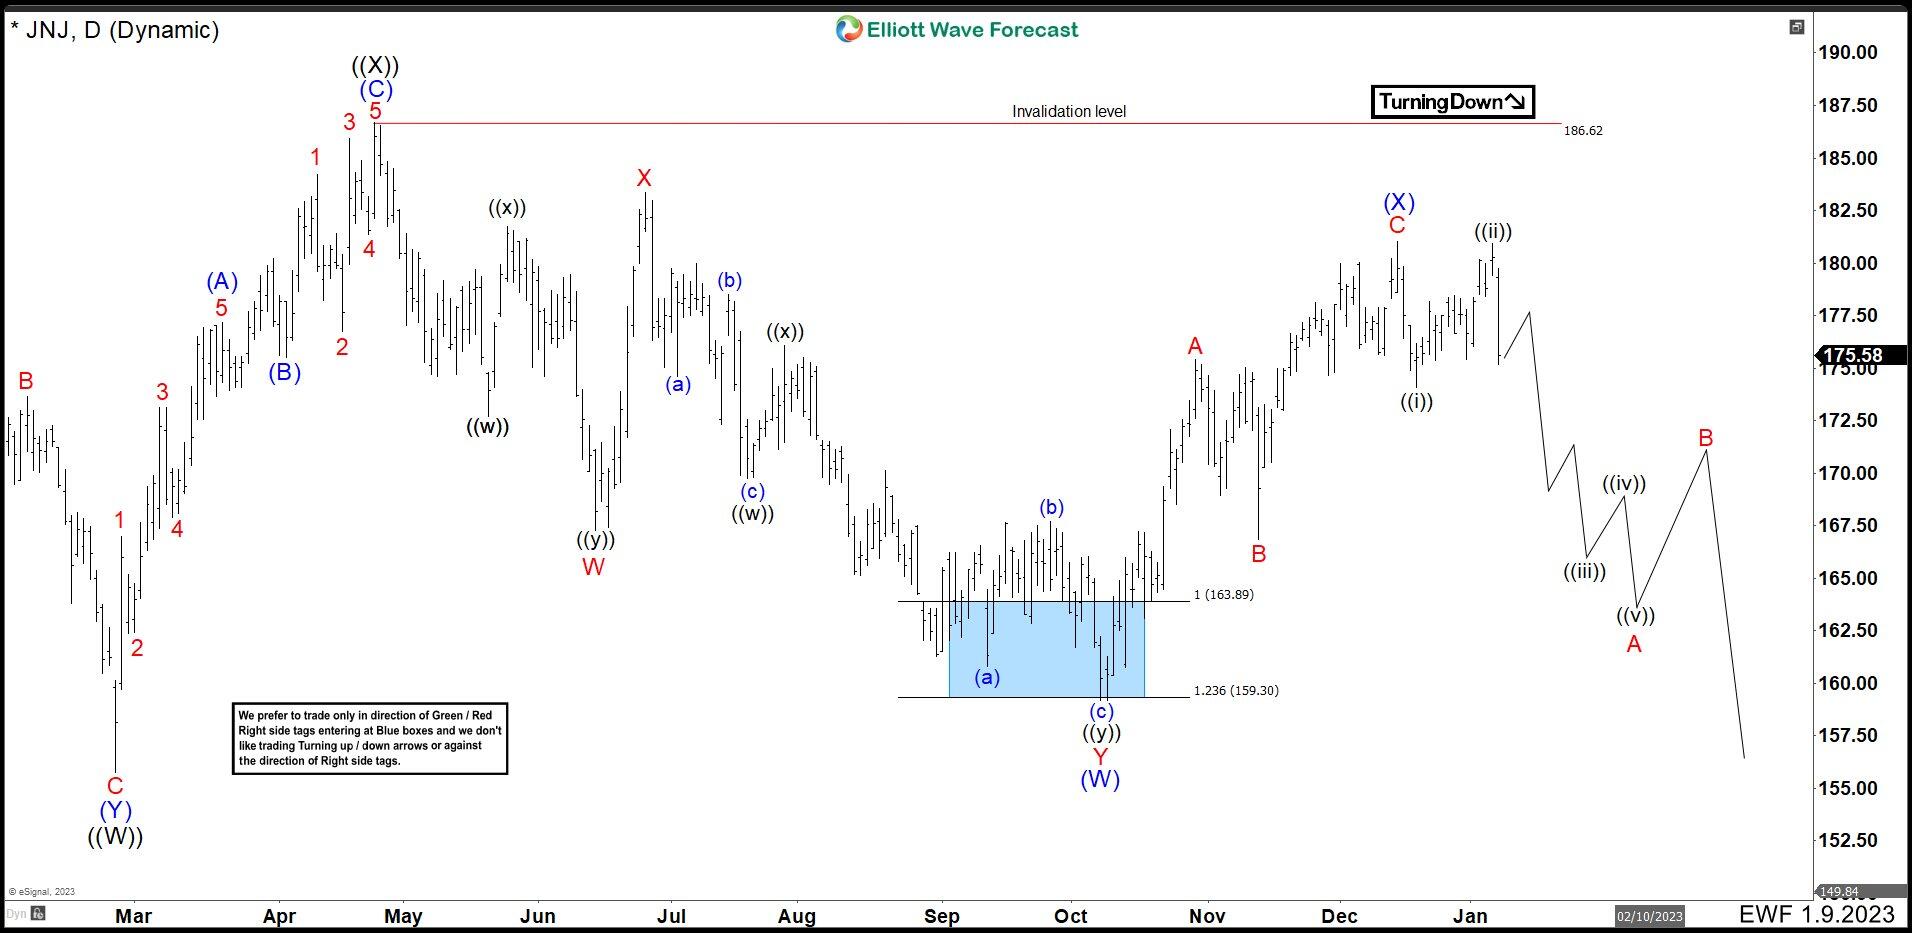
In the last analysis, we predicted that the JNJ share price will continue to fall. The ideal was to make a zigzag ABC correction that would complete wave (Y) of ((Y)) and thus wave II to continue the rally. Well, the market fell building the expected structure and bounced from the 100% Fibonacci extension zone.

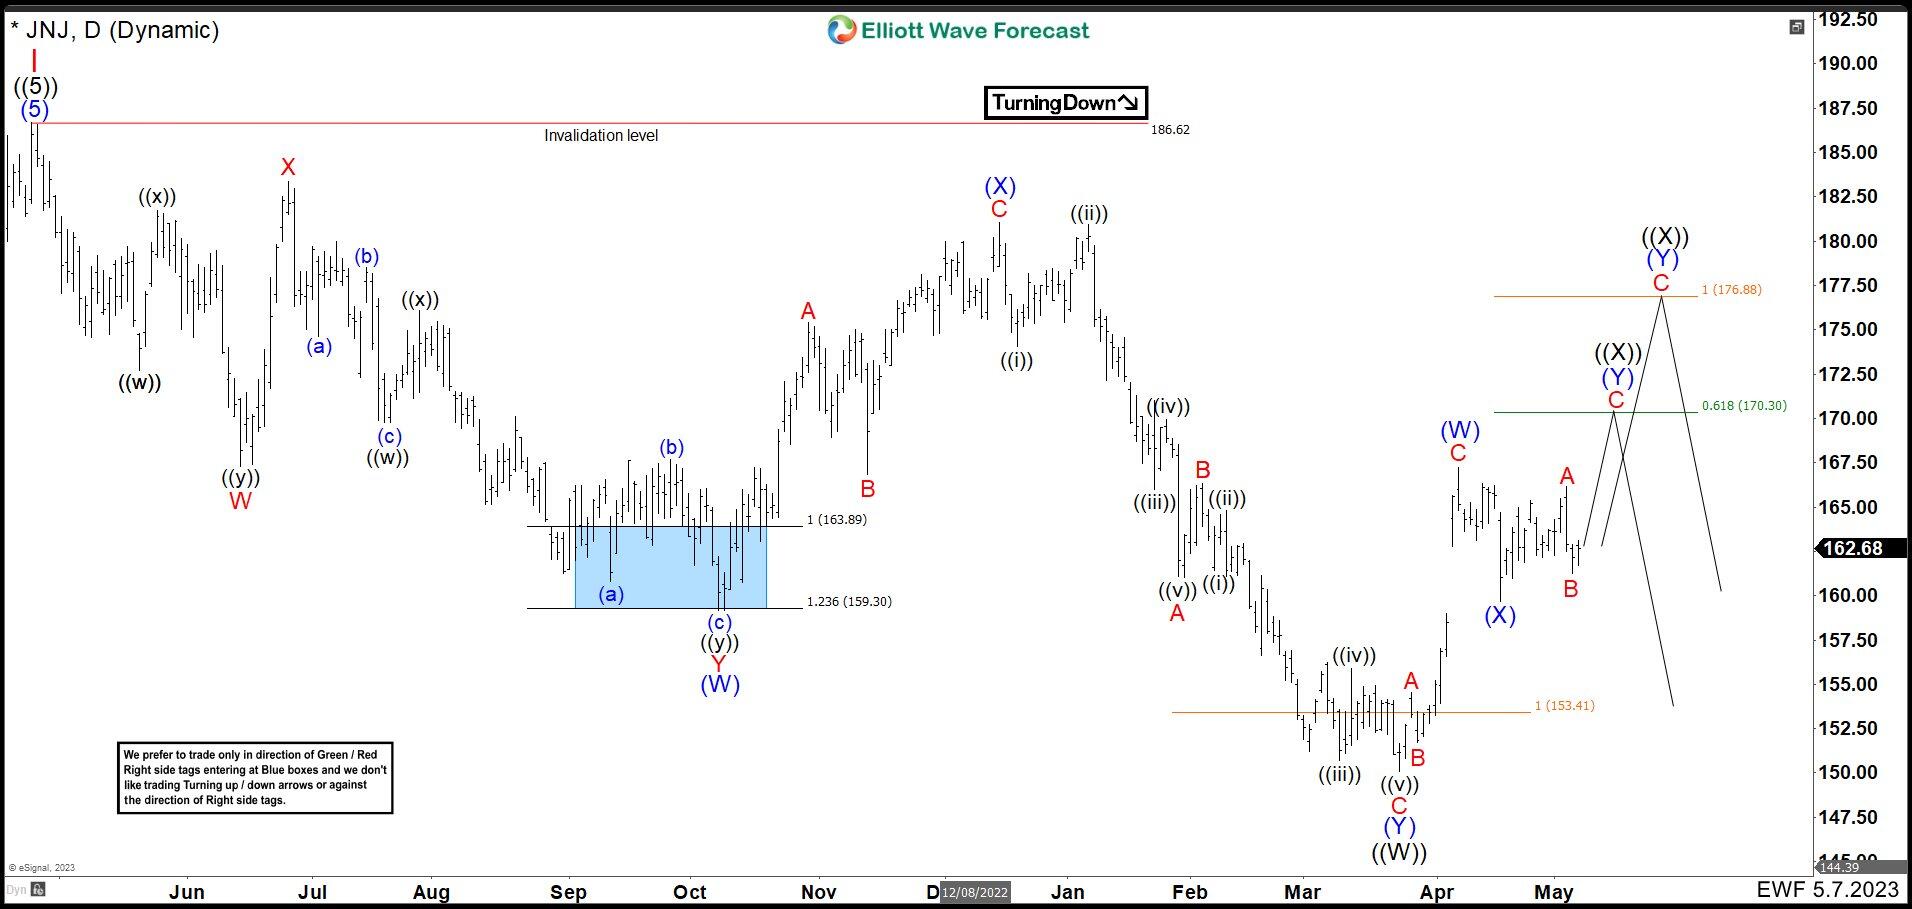
JNJ May 2023 daily chart

In the new chart, we adjust the daily count. We can see that wave I ended at 186.62 and the next 7 waves down completed wave ((W)) at 150.11. The change comes after analyzing the Dow Jones Stock Index and ETFs such as XLV and IHE. By examining these instruments, we can see that the most logical thing is for the JNJ rally to fail. Therefore, it is better to call the current rise as connector ((X)) and then see 3 more waves to the downside. We are marking 2 possibilities. The first that the price reaches 170.30 and falls or that it reaches the equal legs at 176.88 before the sellers enter the market.

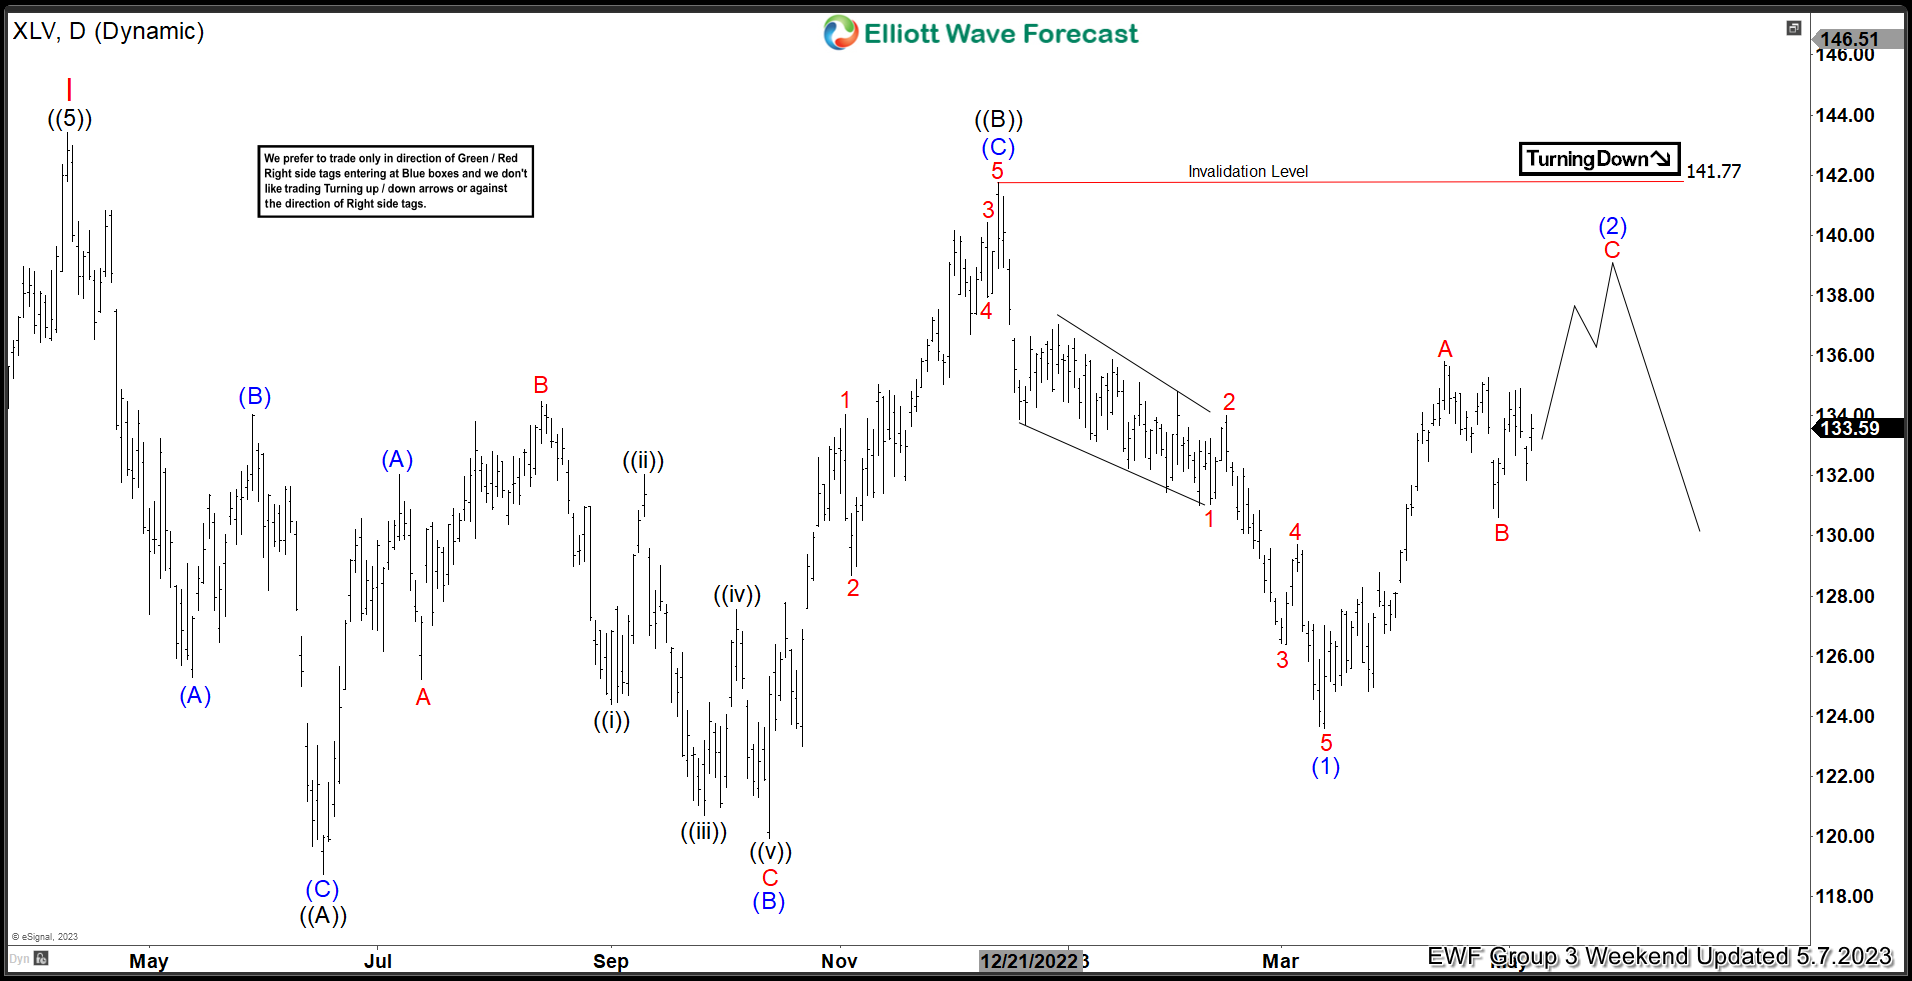
XLV May 7th 2023 daily chart

In the latest daily update of the Health Care Select Sector SPDR Fund (XLV), we can see how the market could be developing a flat correction, and even, the wave ((B)) could build a triangle that would likewise send the fund to the downside. Near term, we see that we must finish wave (2) and for that, the price should move a little higher before entering in bearish movement. As you can see, the structure is very similar to the JNJ stock.

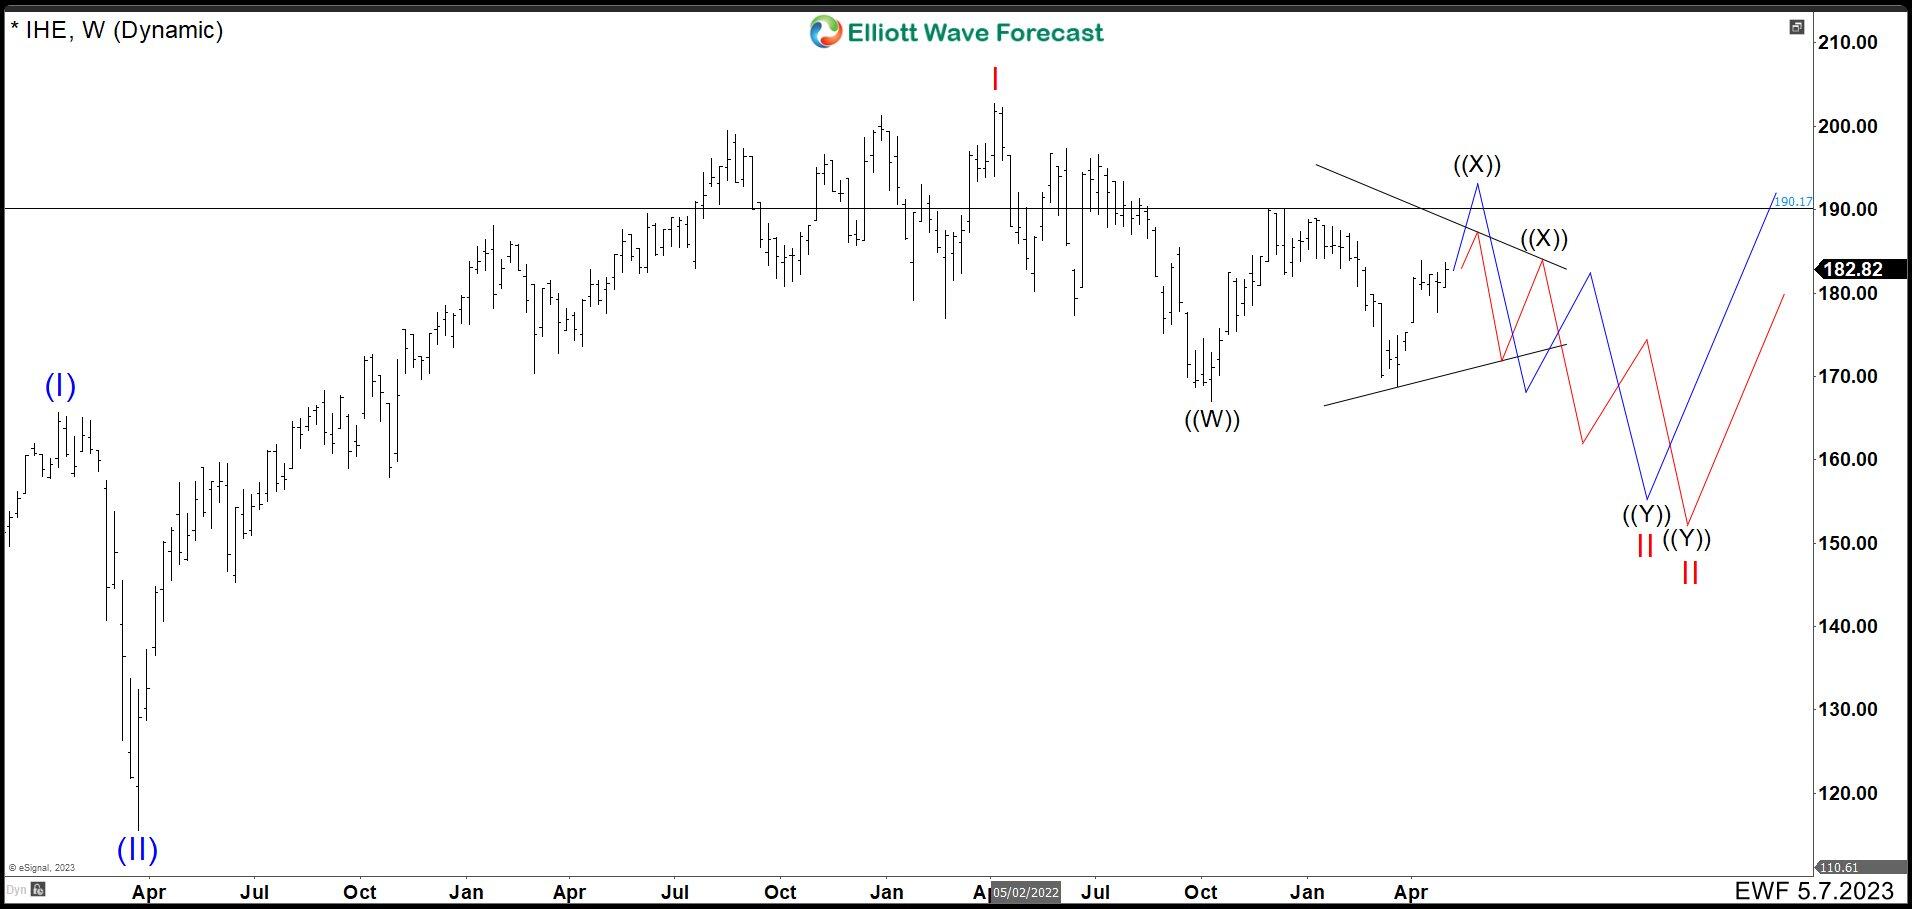
IHE May 7th 2023 weekly chart

In the iShares US Pharmaceuticals ETF (IHE) chart, we can see after completing wave I the fund fell in 3 waves to end wave ((W)). From here, the wave ((X)) has two outputs. The first is for the price to break above 190.17 (blue line) to complete a flat correction. This would be the best to have a clear corrective structure before continuing lower. The other possibility (red line) is that the wave ((X)) is a triangle. The we should see more sideways movement before continuing with the higher degree correction.

Author

Elliott Wave Forecast Team

Elliott Wave Forecast Team

ElliottWave-Forecast.com

More from Elliott Wave Forecast Team
Share:

Editor's Picks

GBP/USD appears well offered near 1.3160

GBP/USD builds on Tuesday’s losses, although it now manages to pick up some pace and bounce off earlier multi-month troughs near 1.3140. The Greenback’s solid performance and continued political turmoil in the UK are keeping Cable under persistent pressure, with little sign of a meaningful recovery.

EUR/USD softens to near 1.1350 as Fed hike bets rise ahead of PCE inflation data

The EUR/USD pair declines to around 1.1355 during the early Asian trading hours on Thursday. The Euro weakens to its lowest level since June 2025 against the US Dollar as traders increase their bets on US interest rate hikes later this year. The US May Personal Consumption Expenditures inflation data will be the highlight on Thursday. 

Gold off YTD lows, still struggles around $4,000 on hawkish Fed bets

Gold is off year-to-date lows, still struggling around $4,000 in the Asian session on Thursday as bears pause following the overnight slump to the lowest level since November 2025. Despite easing inflationary concerns amid falling oil prices, elevated Fed rate-hike bets help the US Dollar preserve its recent strong gains to the highest level since May 2025, weighing on non-yielding bullion.

Crypto market sheds over 50% of its value amid Bitcoin's brief decline below $60K
The crypto market has erased more than half of its value since reaching an all-time high in late 2025. The decline underscores the severity of the recent bear market and lack of a fresh catalyst to revive investor interest, according to a Wednesday X post by The Kobeissi Letter. The total crypto market cap peaked at a record $4.3 trillion on October 6, 2025.
5.90% to 5.45%: Why the Pound ignored the bond market’s relief rally
Keir Starmer resigned on Monday, and the Pound barely moved. That near-silence is the tell. Sterling's real driver these past four months has not been the prime minister, nor the left-leaning frontrunner lining up to replace him, but the long end of the gilt curve, which answers to a force no British politician controls.
Regime change: Inside Kevin Warsh's first move to make the Fed unreadable on purpose

The rate did not move. That was the least interesting thing about Kevin Warsh's first meeting in charge of the Fed. The FOMC held its benchmark at 3.50%-3.75% for the fourth straight meeting, exactly as priced, and then the new chair used his first press conference to dismantle the machinery the market has leaned on for a decade.