|

Jet Blue: A buying opportunity and definition soon

JetBlue Airways Corporation (JBLU), is a major U.S. airline headquartered in Long Island City, Queens, New York. Operating over 1,000 daily flights, it serves around 100 destinations across the Americas and Europe, with a focus on point-to-point travel and key hubs like New York’s JFK Airport. Known for its low-cost model paired with premium amenities—such as in-flight entertainment, free Wi-Fi via Fly-Fi, and the Mint premium cabin service—JetBlue has carved a niche by blending affordability with customer experience. Below we will take a look at the Elliott Wave technical outlook for the company.

JetBlue (JBLUE) Elliott Wave monthly time chart

Chart

Monthly Elliott Wave Chart of Jetblue (JBLUE) above shows that the stock ended wave (II) in super cycle degree at 2.84. It has started to rally higher in wave (III). Up from wave (II), wave I ended at 27.36. Pullback in wave II is in progress and looking to retest 2.84 before turning higher. Down from wave I, wave ((W)) ended at 6.61 and wave ((X)) ended at 21.96. Wave ((Y)) lower is looking to retest 2.84 before the stock resumes higher.

JBLUE daily Elliott Wave chart

Chart

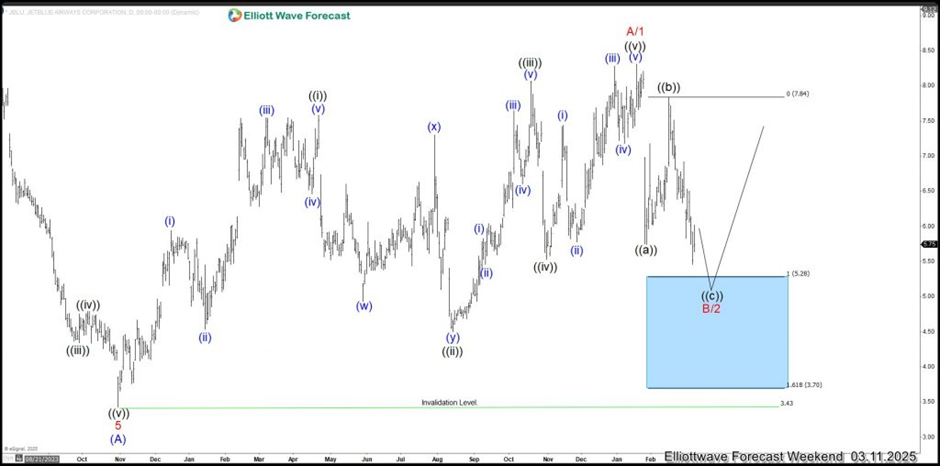
Daily Elliott Wave Chart of Jetblue chart above shows that decline from 4.1.2021 high is in progress as a zigzag Elliott Wave structure. Down from 4.1.2021 high, wave (A) ended at 3.43. Up from there, we can see 5 waves diagonal higher. Wave ((i)) ended at 7.58 and pullback in wave ((ii)) ended at 4.5. Wave ((iii)) higher ended at 8.07 and pullback in wave ((iv)) ended at 5.53. Final leg wave ((v)) ended at 8.31 which completed either wave A or 1. Pullback in wave B or 2 is in progress to correct cycle from 10.31.2023 low before it resumes higher. Expect wave B or 2 to end at the blue box area of 3.7 – 5.28 area for further upside.

Author

Elliott Wave Forecast Team

Elliott Wave Forecast Team

ElliottWave-Forecast.com

More from Elliott Wave Forecast Team
Share:

Editor's Picks

EUR/USD deflates to fresh lows, targets 1.1600

The selling pressure on EUR/USD now gathers extra pace, prompting the pair to hit fresh multi-week lows in the 1.1625-1.1620 band on Friday. The continuation of the downward bias comes in response to further gains in the US Dollar as market participants continue to assess the mixed release of US Nonfarm Payrolls in December.

GBP/USD breaks below 1.3400, challenges the 200-day SMA

GBP/USD remains under heavy fire and retreats for the fourth consecutive day on Friday. Indeed, Cable suffers the strong performance of the Greenback, intensified post-mixed NFP, and trades at shouting distance from its critical 200-day SMA near 1.3380.

Gold flirts with yearly tops around $4,500

Gold keeps its positive bias on Friday, adding to Thursday’s advance and challenging yearly highs in the $4,500 region per troy ounce. The risk-off sentiment favours the yellow metal despite the firmer tone in the Greenback and rising US Treasury yields.

Crypto Today: Bitcoin, Ethereum, XRP risk further decline as market fear persists amid slowing demand

Bitcoin holds $90,000 but stays below the 50-day EMA as institutional demand wanes. Ethereum steadies above $3,000 but remains structurally weak due to ETF outflows. XRP ETFs resume inflows, but the price struggles to gain ground above key support.

Week ahead – US CPI might challenge the geopolitics-boosted Dollar

Geopolitics may try to steal the limelight from US data. A possible US Supreme Court ruling on tariffs could dictate market movements. A crammed data calendar next week, US CPI comes on Tuesday; Fedspeak to intensify.

XRP trades under pressure amid weak retail demand

XRP presses down on the 50-day EMA support as risk-averse sentiment spreads despite a positive start to 2026. XRP faces declining retail demand, as reflected in futures Open Interest, which has fallen to $4.15 billion.