Japanese Yen retains intraday positive bias against retreating USD; US-China trade talks in focus
- The Japanese Yen attracts some intraday buyers on Friday, though the upside seems limited.
- The mixed Japanese macro data boosts the case for further BoJ rate hikes and backs the JPY.
- The Fed’s hawkish pause favors the USD bulls and supports USD/JPY amid trade optimism.

The Japanese Yen (JPY) remains on the front foot against a broadly retreating US Dollar (USD) and drags the USD/JPY pair to the 145.00 psychological mark during the first half of the European session on Friday. The upbeat Household Spending data from Japan boosts the case for further rate hikes by the Bank of Japan (BoJ). Moreover, reviving safe-haven demand, amid persistently rising geopolitical risks, assists the JPY to stage a modest recovery from a four-week low touched against its American counterpart released earlier today.
Meanwhile, the US-UK trade deal on Thursday raised hopes for more such deals with other countries. Adding to this, the optimism over the start of US-China tariff negotiations in Switzerland on Sunday remains supportive of a generally positive risk tone, which might cap the JPY. Furthermore, the Federal Reserve's (Fed) hawkish pause and easing US recession fears should limit the downside for the USD. This warrants caution before confirming that the USD/JPY pair's recent recovery from a multi-month low has run out of steam.
Japanese Yen bulls retain intraday control amid geopolitical risks, hawkish BoJ expectations
- Government data released earlier this Friday showed that Japan's household spending rose 0.4% in March and 2.1% from a year earlier, both surpassing market forecasts. Adding to this, expectations that sustained wage hikes will boost consumer spending and inflation in Japan suggest that the Bank of Japan may not abandon its rate-hike plans altogether.
- In fact, minutes from the BoJ's monetary policy meeting held on March 18-19 revealed on Thursday that the central bank remains ready to hike interest rates further if inflation trends hold. This, in turn, backs the case for further policy tightening by the BoJ in 2025 and assists the Japanese Yen to gain some positive traction during the Asian session on Friday.
- Separately, Japanese real wages decreased for a third consecutive month in March. In fact, inflation-adjusted wages dropped 2.1% from a year earlier following a revised 1.5% fall in February and a 2.8% decline in January. Furthermore, the consumer inflation rate used to calculate real wages rose 4.2% YoY in March, down slightly from 4.3% in the previous month.
- The data adds to worries about Japan’s growth outlook amid the uncertainty over US tariffs and ahead of a first-quarter Gross Domestic Product report next week. This, in turn, could act as a headwind for the JPY amid the upbeat market mood, led by the optimism over the US-UK trade deal and the start of US-China tariff negotiations in Switzerland over the week.
- Meanwhile, positive developments help to ease market concerns that an all-out trade war might trigger a US recession. Adding to this, the Federal Reserve's signal that it is not leaning towards cutting interest rates anytime soon, despite the heightened economic uncertainty, lifts the US Dollar to a four-week high, which, in turn, should lend support to the USD/JPY pair.
- There isn't any relevant market-moving economic data due for release from the US on Friday. However, scheduled speeches from a slew of influential FOMC members will drive the USD demand later during the North American session. Furthermore, the broader risk sentiment should contribute to producing short-term trading opportunities on the last day of the week.
USD/JPY could accelerate slide below 145.00, or 200-period SMA on 4-hour chart
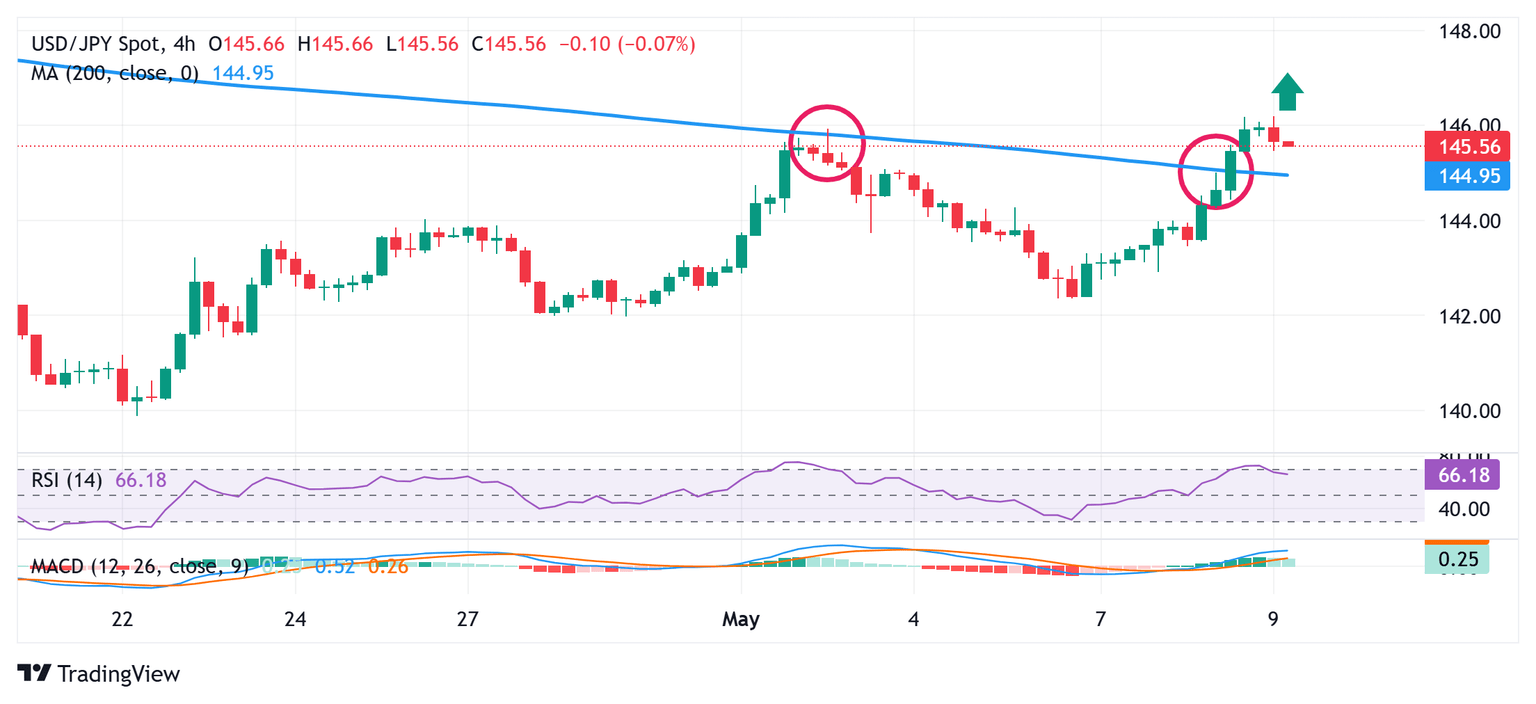
From a technical perspective, the USD/JPY pair's overnight breakout through the 200-period Simple Moving Average (SMA) on the 4-hour chart could be seen as a key trigger for bullish traders. Moreover, oscillators on the daily chart have started gaining positive traction and are holding in bullish territory on hourly charts. This supports prospects for the emergence of some dip-buyers at lower levels, which should limit the downside for spot prices near the 145.00 psychological mark (200-period SMA on the 4-hour chart). That said, a convincing break below the said resistance-turned-support might prompt some technical selling and drag the currency pair to the next relevant support near the 144.45 region.
Meanwhile, bulls might now wait for a sustained move and acceptance above the 146.00 round figure before placing fresh bets. Some follow-through buying beyond the Asian session peak, around the 146.15-146.20 region, will reaffirm the near-term positive outlook and pave the way for a further near-term appreciating move for the USD/JPY pair. The subsequent move up could lift spot prices to an intermediate hurdle near the 146.75-146.80 region en route to the 147.00 mark. The momentum could extend further towards the 147.70 horizontal resistance before the pair aims to conquer the 148.00 round figure and climb further towards the 148.25-148.30 supply zone.
US Dollar PRICE Today
The table below shows the percentage change of US Dollar (USD) against listed major currencies today. US Dollar was the strongest against the New Zealand Dollar.
| USD | EUR | GBP | JPY | CAD | AUD | NZD | CHF | |
|---|---|---|---|---|---|---|---|---|
| USD | -0.16% | -0.07% | -0.41% | -0.05% | -0.01% | 0.22% | -0.15% | |
| EUR | 0.16% | 0.07% | -0.26% | 0.09% | 0.15% | 0.36% | -0.00% | |
| GBP | 0.07% | -0.07% | -0.33% | 0.03% | 0.08% | 0.29% | -0.04% | |
| JPY | 0.41% | 0.26% | 0.33% | 0.39% | 0.43% | 0.64% | 0.31% | |
| CAD | 0.05% | -0.09% | -0.03% | -0.39% | 0.04% | 0.27% | -0.07% | |
| AUD | 0.00% | -0.15% | -0.08% | -0.43% | -0.04% | 0.21% | -0.12% | |
| NZD | -0.22% | -0.36% | -0.29% | -0.64% | -0.27% | -0.21% | -0.34% | |
| CHF | 0.15% | 0.00% | 0.04% | -0.31% | 0.07% | 0.12% | 0.34% |
The heat map shows percentage changes of major currencies against each other. The base currency is picked from the left column, while the quote currency is picked from the top row. For example, if you pick the US Dollar from the left column and move along the horizontal line to the Japanese Yen, the percentage change displayed in the box will represent USD (base)/JPY (quote).
Author

Haresh Menghani
FXStreet
Haresh Menghani is a detail-oriented professional with 10+ years of extensive experience in analysing the global financial markets.


