SPDR S&P 500 ETF Trust (SPY) Stock News and Forecast: Why is the SPY still going up?
- SPY and IWM helped on Wednesday by inflation data.
- US CPI was in line with economist expectations.
- SPY still grinding slowly higher, IWM rangebound

Another day another all-time high for the SPY on Wednesday as the US CPI data was in line with expectations and so not too shocking to equity traders. We had called this one higher so were caught off guard by the in-line print. The inflation data is still high and getting higher but not yet high enough to cause the sell-off that many have been anticipating. Recent CFTC data shows shorts getting squeezed and covering futures positions in the S&P while fund managers have also reduced long positions. The longer this grind higher continues the more likely we are to eventually see a more significant bust but for now, price is the ultimate indicator as we say and that is still guiding us higher. The US ten-year yield has refused to budge following the CPI data on Wednesday meaning the bond market may be preparing itself for a showdown with the Fed. However, the Put/Call ratio continues to move higher as more and more participants become convinced of the market being too high and ready for a correction. This would signal to us that this grind has more room to go yet. If the majority are bearish and the market keeps going up then that draws its own conclusions. Once the bearish masses have bailed and covered shorts is when this SPY is more likely to turn over.
SPY stock forecast
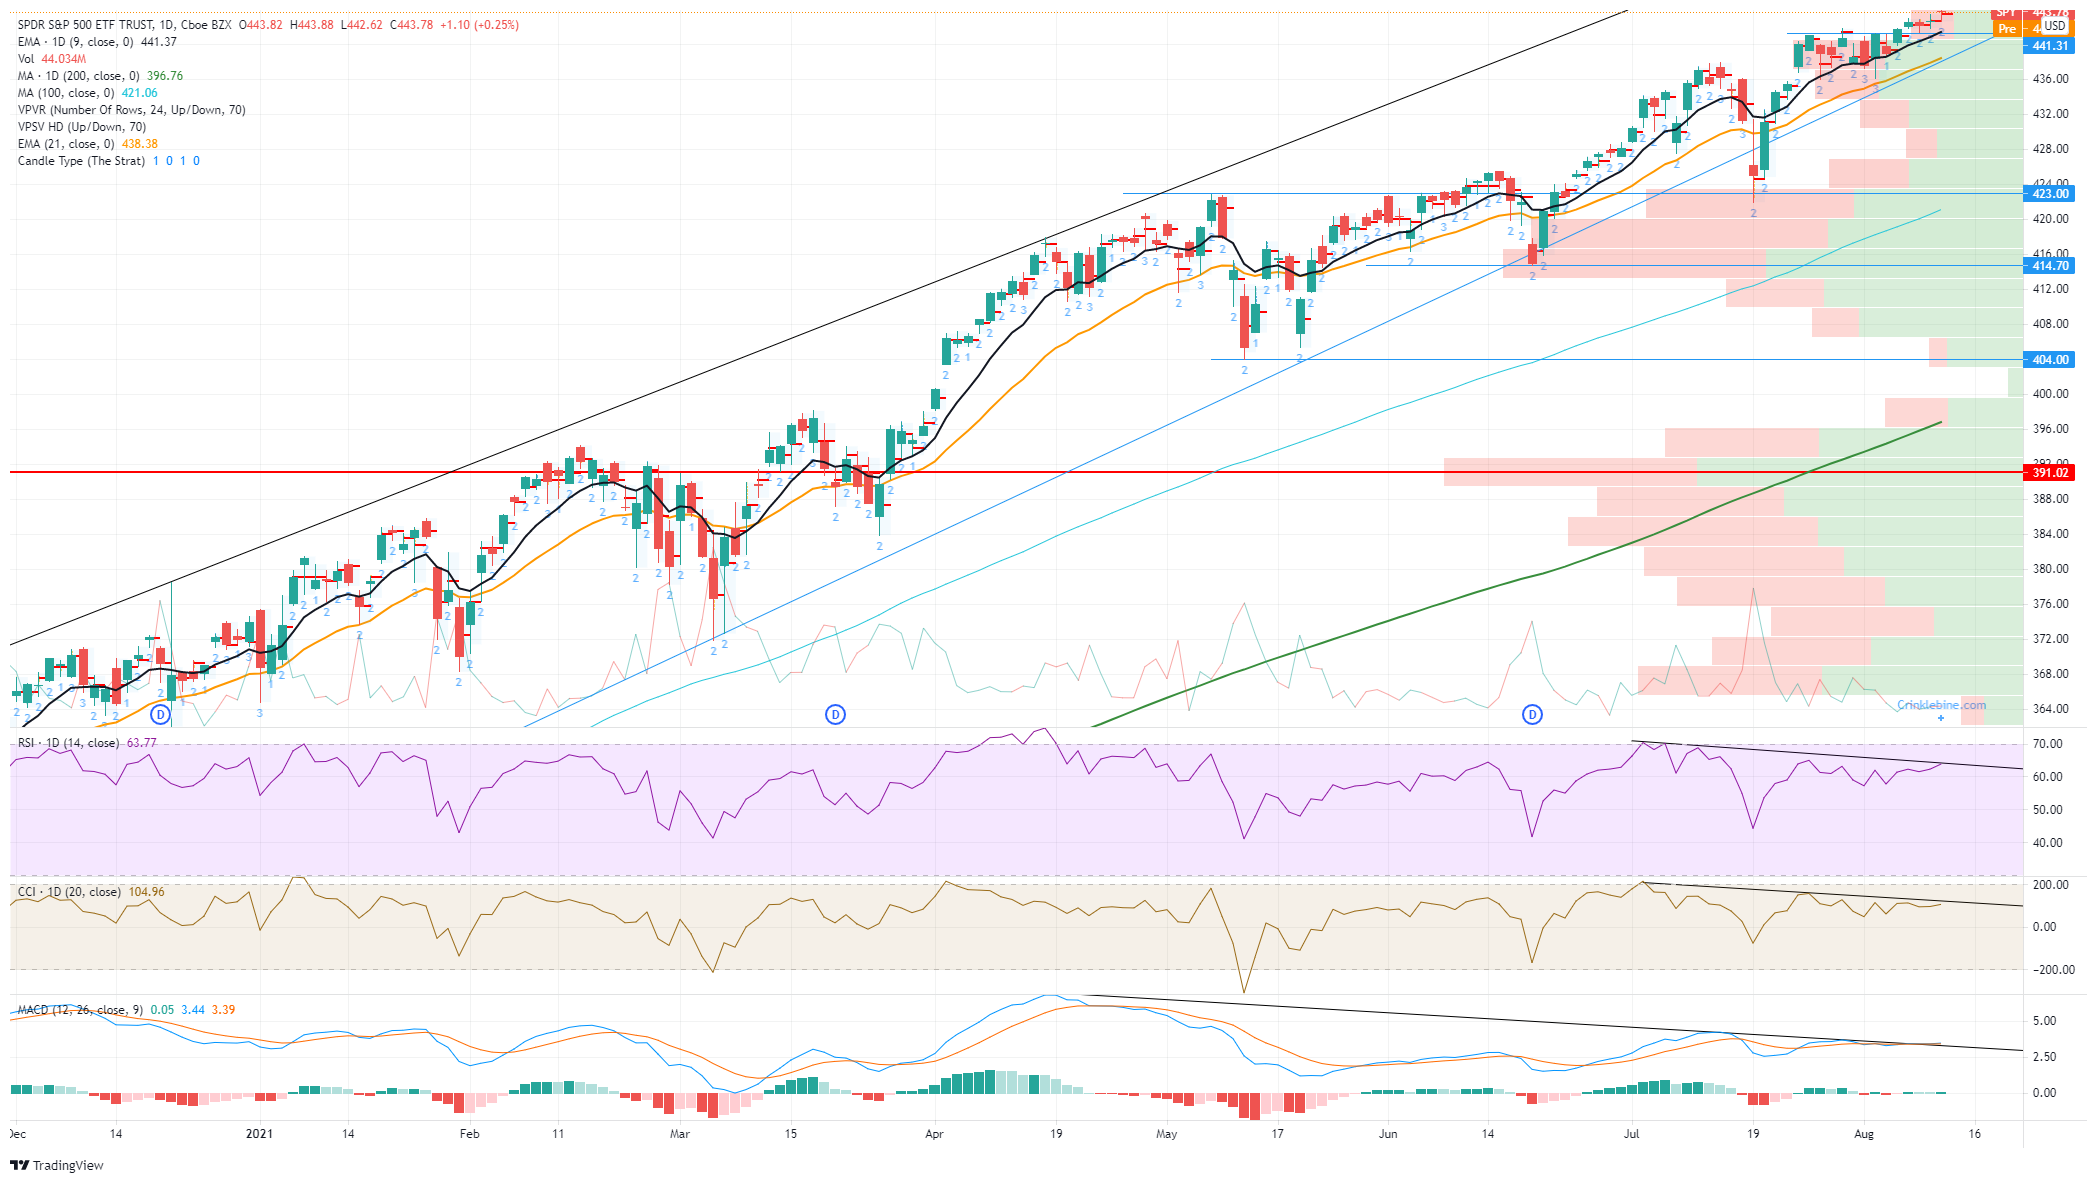
We realize we are flip-flopping our bearish call from yesterday but being in the market means changing your mind and being flexible. You have to be able to go with the flow and flip sides from time to time. We expect the grind to continue and frustrate the bearish masses for a little while longer. The momentum indicators are providing warnings signs with bearish divergences across the Moving Average Convergence Divergence (MACD), Relative Strength Index (RSI), and Commodity Channel Index (CCI) so please use careful risk management and stops. $441.31 is the key to hold the bullish move.
Our levels from yesterday still hold short-term support at $441.31 as mentioned. If this were to break there is a small support zone at $423 with the volume profile lending support here. The preferred buying point though is at $414.70. This may seem like a strong call, nearly 10%, but it only brings us back to where the SPY was trading in July. The volume profile is at its strongest here, so this level needs to hold. A break could be sharp, as volume dries up worryingly until $390.
Short term we see more bears being frustrated by the grind higher but in the medium term be prepared for a sell off. Breaking $441 would be the current signal for this we feel.
IWM stock forecast
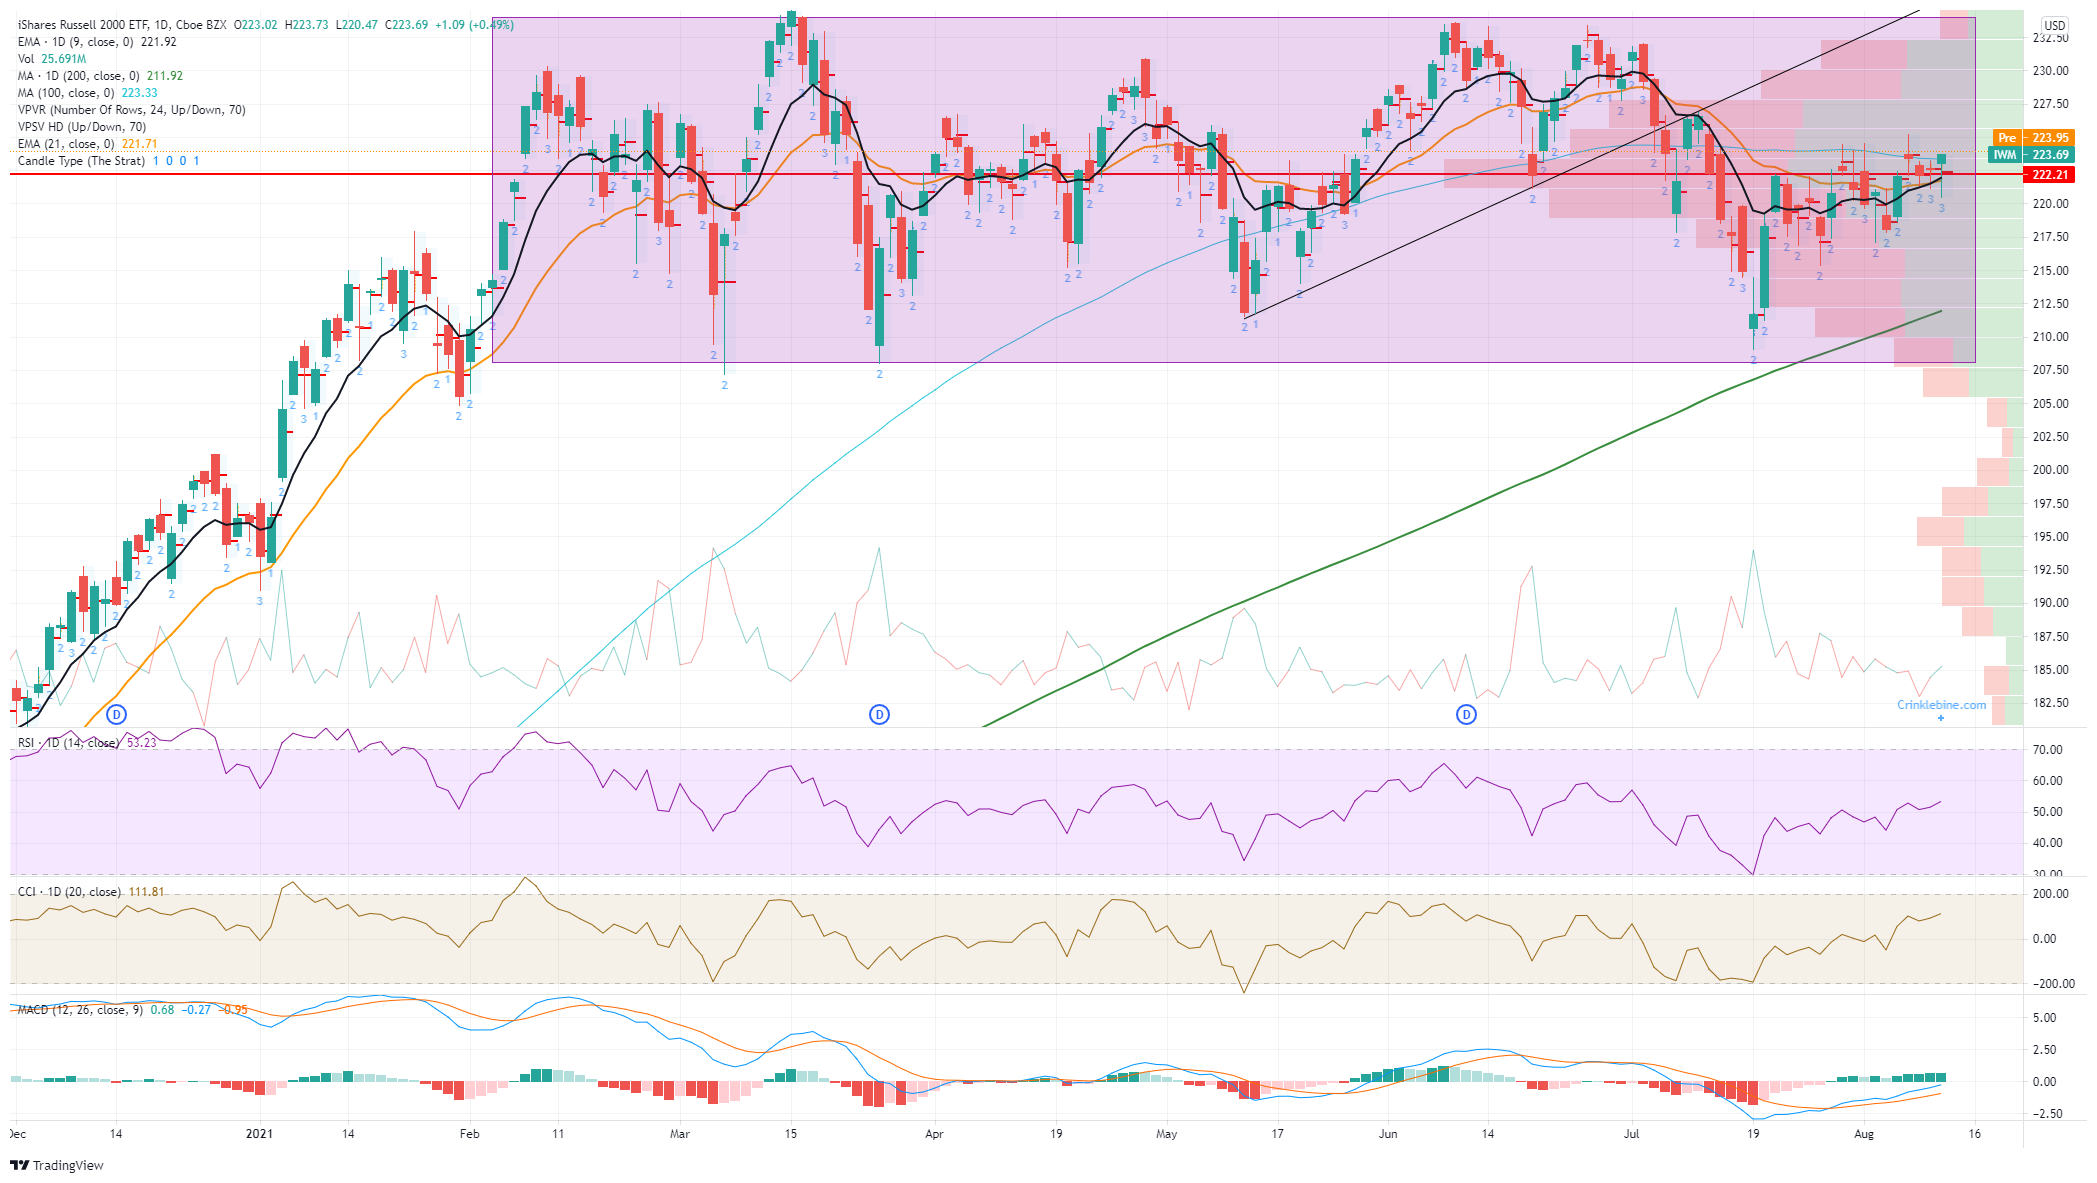
A quick look over at the broader Russell 2000 (IWM) shows it is still stuck in a range and looking to breakout. Watch this one for a possible leading indicator.
The RSI is gaining strength and trending higher and IWM is above the 9 and 21-day moving averages so is skewed more to the upside.
Like this article? Help us with some feedback by answering this survey:
Premium
You have reached your limit of 3 free articles for this month.
Start your subscription and get access to all our original articles.
Author

Ivan Brian
FXStreet
Ivan Brian started his career with AIB Bank in corporate finance and then worked for seven years at Baxter. He started as a macro analyst before becoming Head of Research and then CFO.


