Is Wall Street flirting with a dot-com 2.0 bubble crash?
-
AI investments add more fuel to Wall Street uptrends.
-
But worries about a dot-com-style bubble emerge.
-
Earnings season starts next week, Fed signals also critical.
-
Valuations surge, market breadth rings alarm bells.

AI euphoria continues
Wall Street continues to defy gravity, with all three of Wall Street’s main indices hitting record highs in October, even with the US government shut down. It seems that investors are not worried yet about any implications the standoff in the US Congress may have and remain willing to ride the AI bandwagon, especially after the latest announcements regarding investments from tech-goliaths.
Two weeks ago, Nvidia announced it will invest as much as $100bn in Open AI’s project to build a huge data center that could power a major city, with Open AI pledging to use millions of Nvidia’s chips. This week, Open AI struck another deal with Advance Micro Devices (AMD).
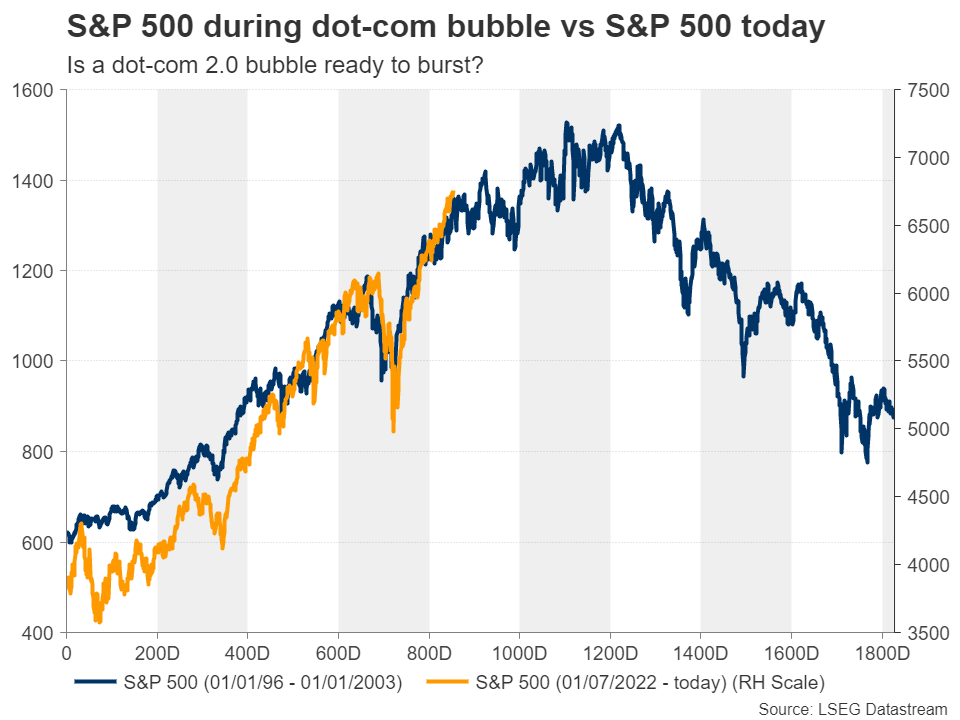
Is a dot-com bubble 2.0 building?
Without concrete evidence yet that such colossal investments could translate into massive profits, there are analysts who are worried about a dot-com-style bubble. Back in the late 90s, there was a trend of circular deals between startups, where firms bought each other’s services to inflate observed growth. Now, the AI-giants are spending far more than the startups then, but the investments are not fueled by debt this time. The big tech players have huge balance sheets and cash flows.
On the flip side of the coin, with the market so heavily concentrated in companies that are largely AI-reliant, disappointing profitability could inflict serious damage on Wall Street indices. The key test as to whether the current momentum rally will continue may be earnings revisions and fed communication.
Earnings and Fed to prove critical drivers
With regards to earnings revisions, the narrative is straightforward. The Q3 earnings season is scheduled to begin next week and for the first time in recent history, analysts have raised their estimates during the quarter rather than cutting them, which implies optimism about corporate performance.
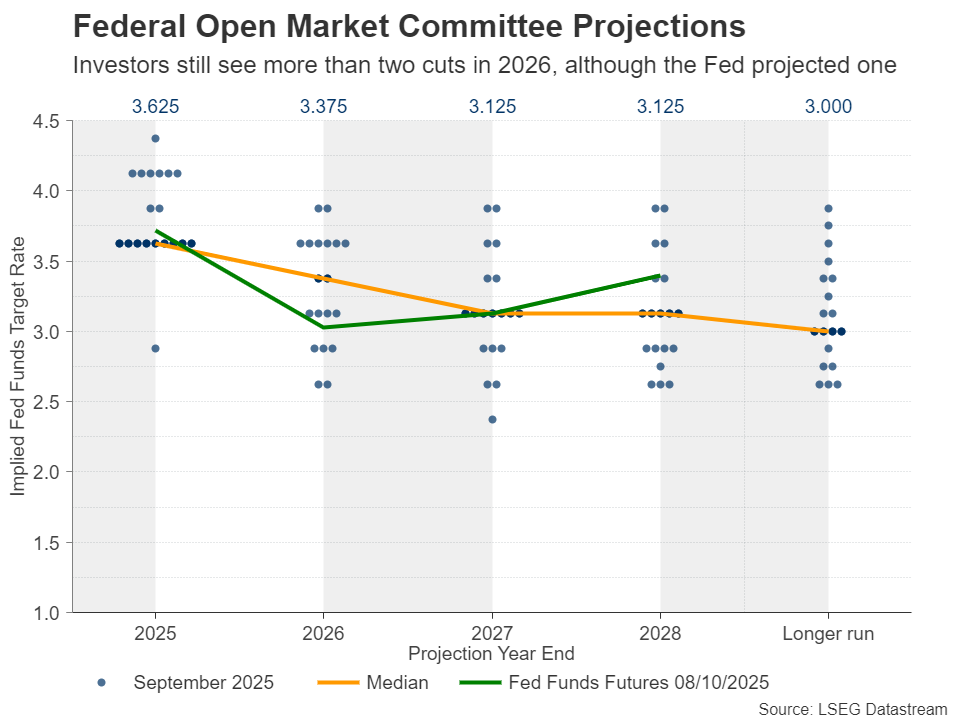
As for the Fed, the market continues to see two more rate cuts this year and nearly another three in 2026, which contrasts the Fed’s projection of only one quarter-point reduction next year. With Fed- and private-released data corroborating the notion that the labor market is softening, investors may remain convinced that the Fed may need to cut borrowing costs more aggressively than the dot plot suggested. Lower interest rates also mean higher present values for firms that are valued by discounting projected free cash flows for the quarters and years ahead. So, high growth tech firms may continue to benefit from the market’s dovish interest rate expectations.
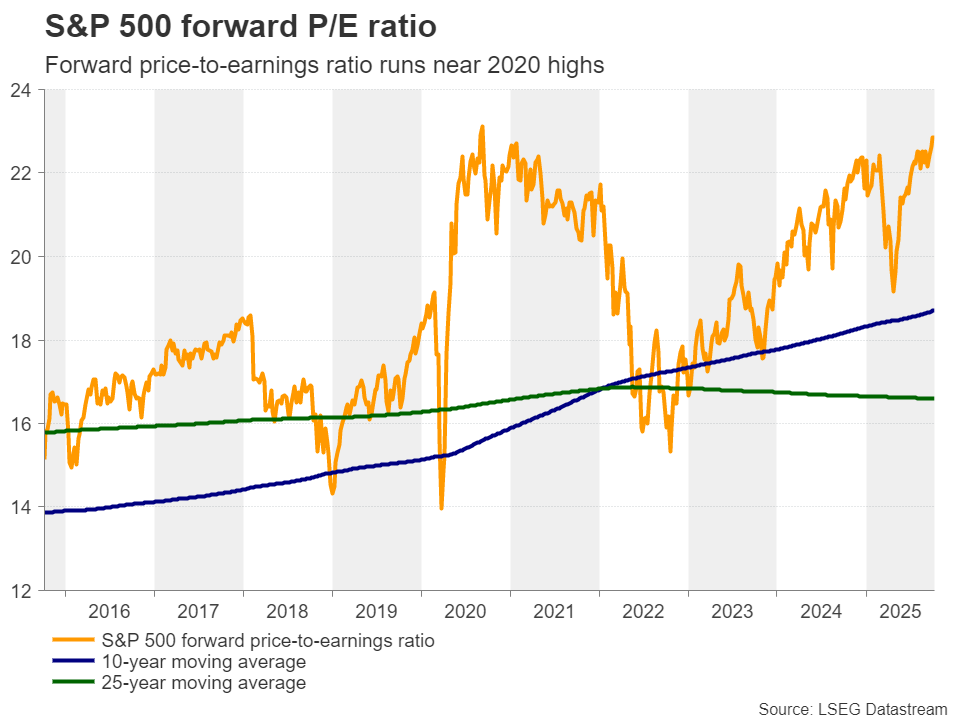
Valuations surge to 2020 highs
Speaking about valuations, the forward price-to-earnings ratio of the S&P 500 is at 22.85x, slightly below the 2020 of 23.11x, which increases the risk of a steep slide soon. The increasing safe-haven demand, especially for gold, may be an indication of investors trying to protect their risk exposure in case things fall out of orbit.
But overvaluations are not the only variable magnifying Wall Street’s downside risks. A prolonged shutdown could also turn out to be a reason for concern if incoming data starts suggesting that it is negatively impacting the broader economy. Polymarket assigns a 72% probability that the shutdown will last at least two weeks, which increases the risk of an economic impact. However, it is worth mentioning that during Trump’s first term, when the shutdown lasted 35 days, all three of Wall Street’s main indices gained between 11% and 13%.
S&P 500 in uptrend, but breadth concerns emerge
From a technical standpoint, the uptrend in the S&P 500 remains well intact, with the index hitting a new all-time high of 6755 on Tuesday. Although the price chart does not suggest any signs of reversal, breadth indicators, like the advance/decline ratio and McClellan oscillator corroborate the notion of increasing downside risks.
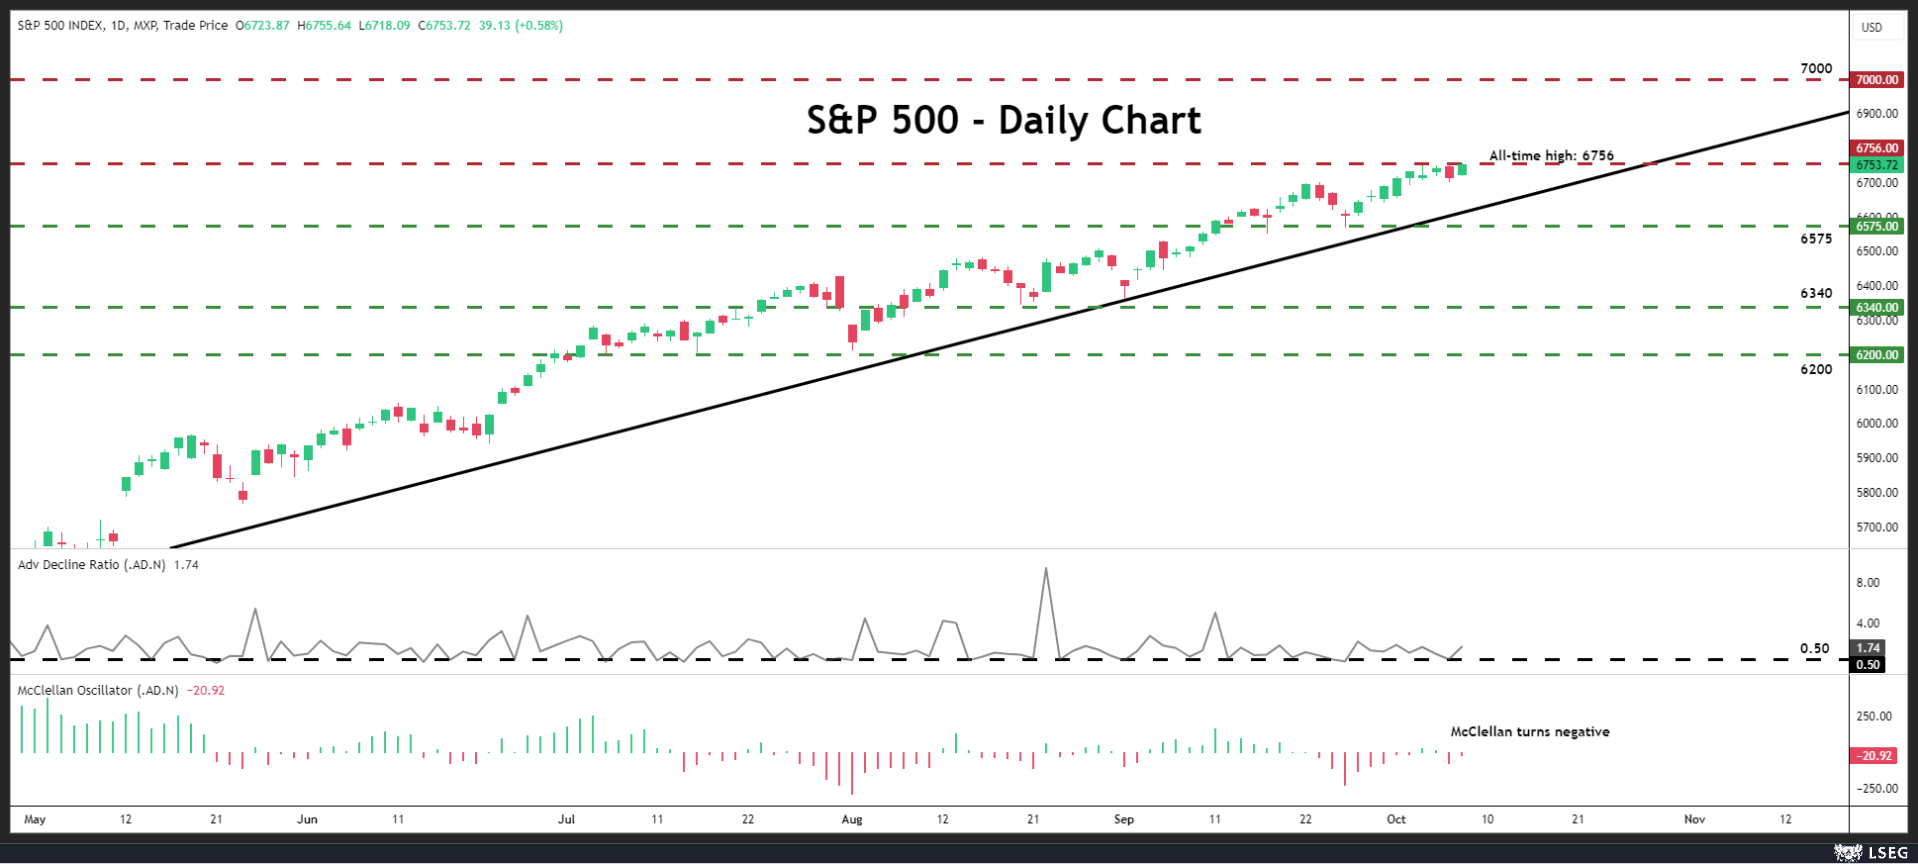
The A/D ratio indicator measures the number of stocks advancing to the number of stocks declining, and during the current uptrend, the 0.50 level has been acting as a magnet, which means that, most of the time, stocks falling are double in number to the stocks advancing. The McClellan oscillator measures breadth momentum; i.e. how strongly advancing and declining stocks support a market move. It just turned negative, suggesting that declining stocks may be more impactful now.
However, as long as the S&P 500 is trading above the uptrend line drawn from the low of May 7, the medium-term picture will be positive. A break above the all-time high of 6755 may see scope for extensions towards the psychological round figure of 7000. On the downside, a break below the low of September 25 at 6575 could dismiss the bullish case and perhaps allow declines towards 6340, a support marked by the low of August 20.
Author

Charalampos joined the XM Investment Research department in August 2022 as a senior investment analyst.


