Is this the beginning? Insights on bearish distribution patterns [Video]
Watch the video from the WLGC session on 11 Mar 2025 to find out the following:
-
How can growth stocks be used to gauge the development of a bear market on top of price action?
-
How the Death Cross could unfold in the S&P 500 using the 2022 analogue comparison.
-
The capitulation moment traders need to pay attention to even if a relief rally happens.
-
and a lot more...
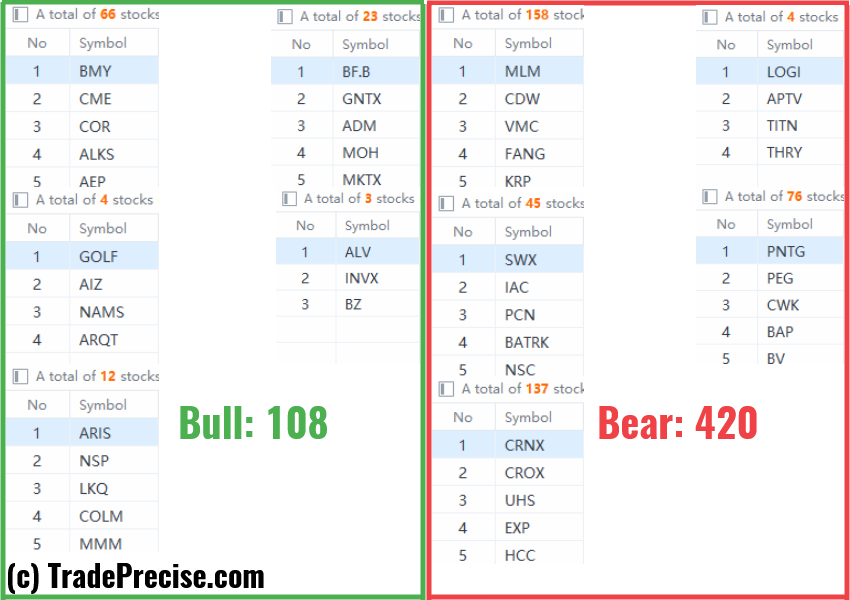
Market environment
The bullish vs. bearish setup is 108 to 420 from the screenshot of my stock screener below.
Three stocks ready to soar
12 actionable setups such as AEM, ROOT, EXEL were discussed during the live session before the market open (BMO).
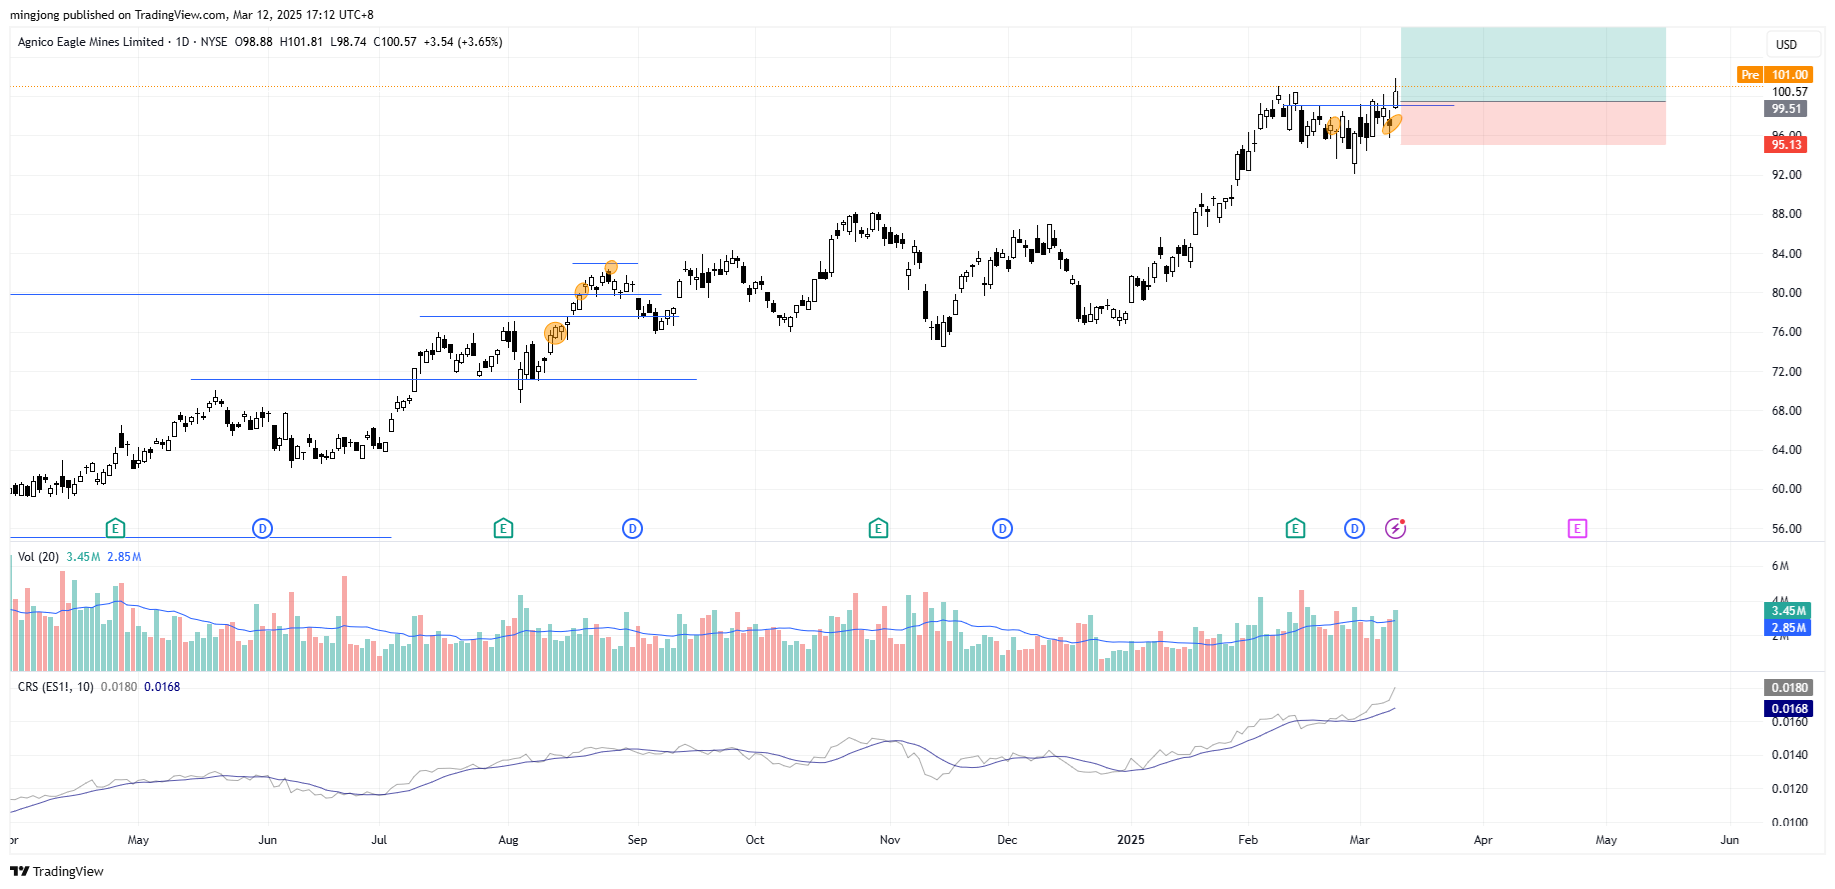
Agnico Eagle Mines Limited (AEM)
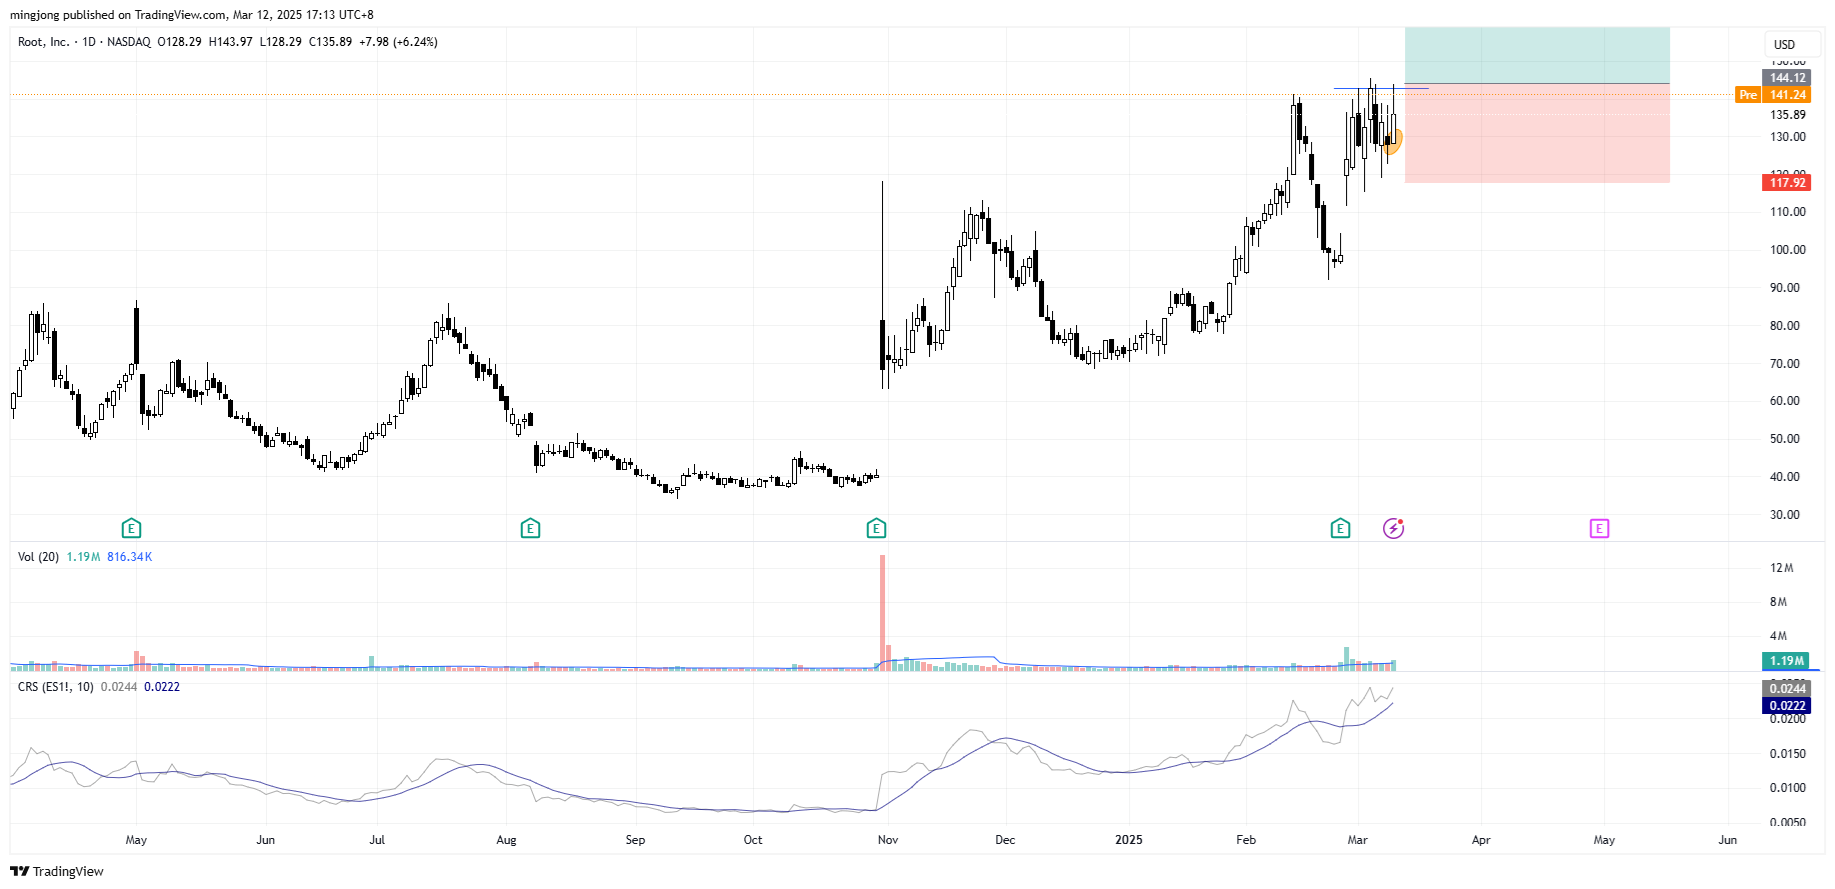
Root (ROOT)
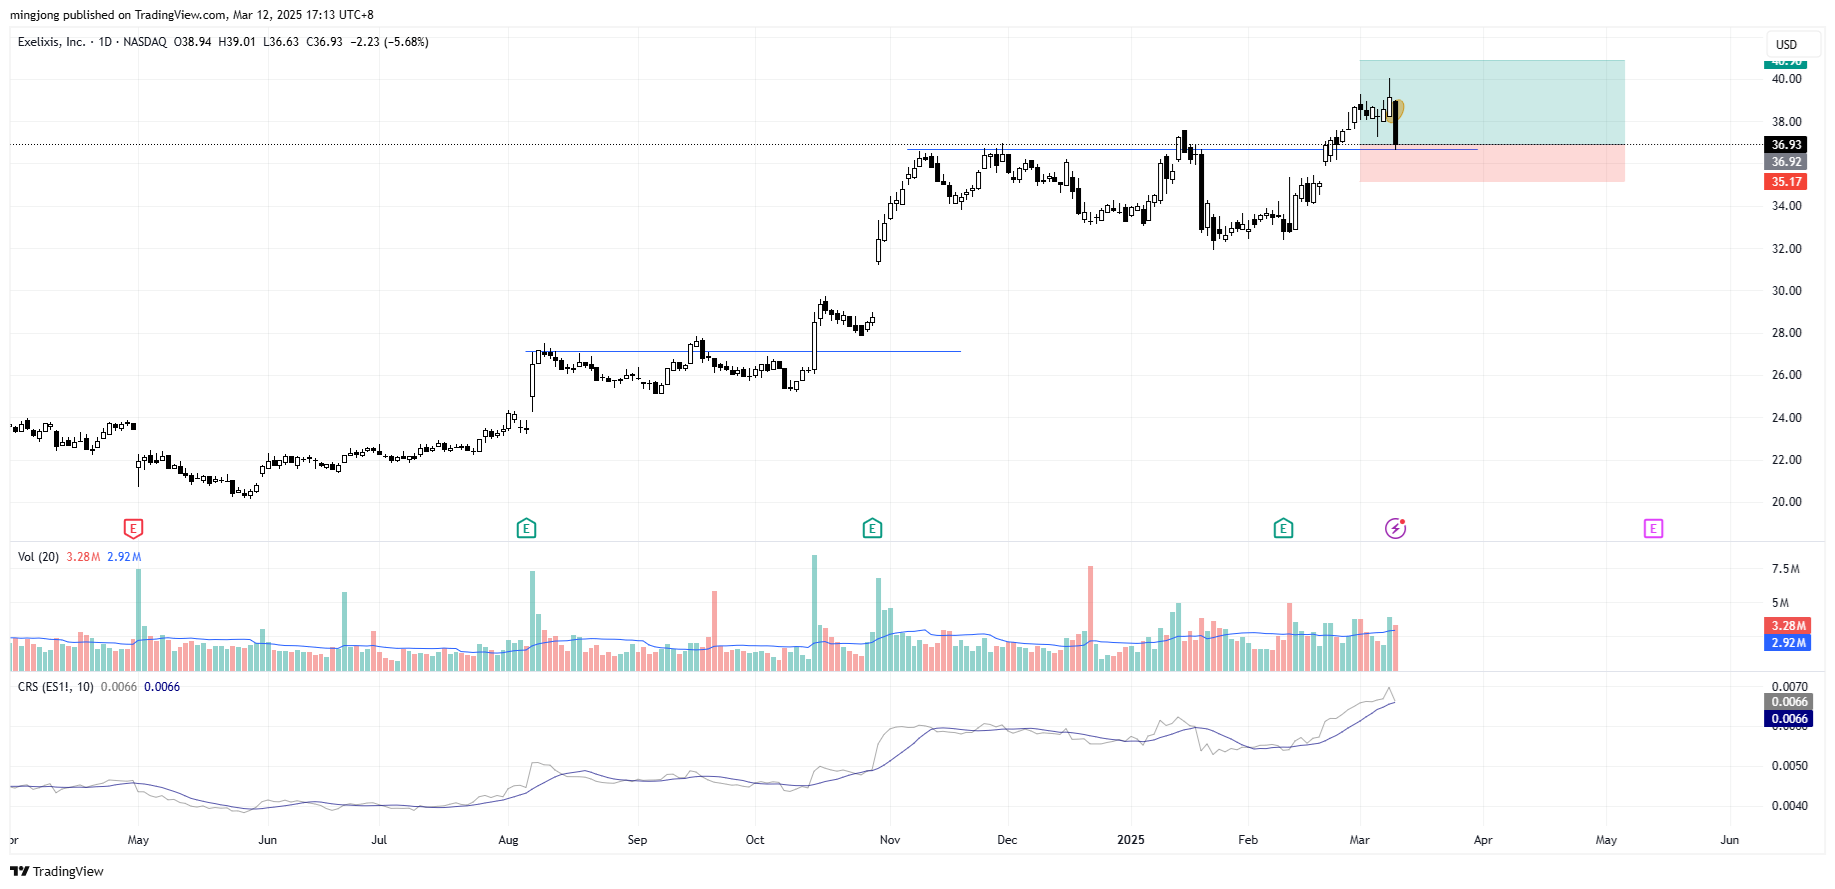
Exelixis (EXEL)
Author

Ming Jong Tey
Independent Analyst
Ming Jong Tey has been trading since 2008. He started his learning journey from technical analysis (indicators, Fibonacci, etc...) to value investing. Throughout his journey, he develops an interest in price action with chart pattern trading.


