Is the Semiconductor Index topping out?

In our previous update from July 1, we showed that the Elliott Wave (EW) Principle for the Semiconductor Index (SOX) accurately predicted the index’s “up->down->up” pattern two weeks in advance, showcasing the strength and validity of the EW. Additionally, looking ahead, our preferred EW count indicated that
“the green W[ave]-3/c is likely to complete in the ideal $5,745+/-100 target zone over the next few days. The market can then determine whether it will provide us with the green W-4, -5 sequence, or if the larger bounce we have expected since early April has already been finished.
Fast forward to today, and the SOX has remained in the ideal $5,745+/-100 zone for over three weeks, highlighting the significance of this price range. See Figure 1 below.
Figure 1. Our preferred short-term EW count with several technical indicators and moving averages
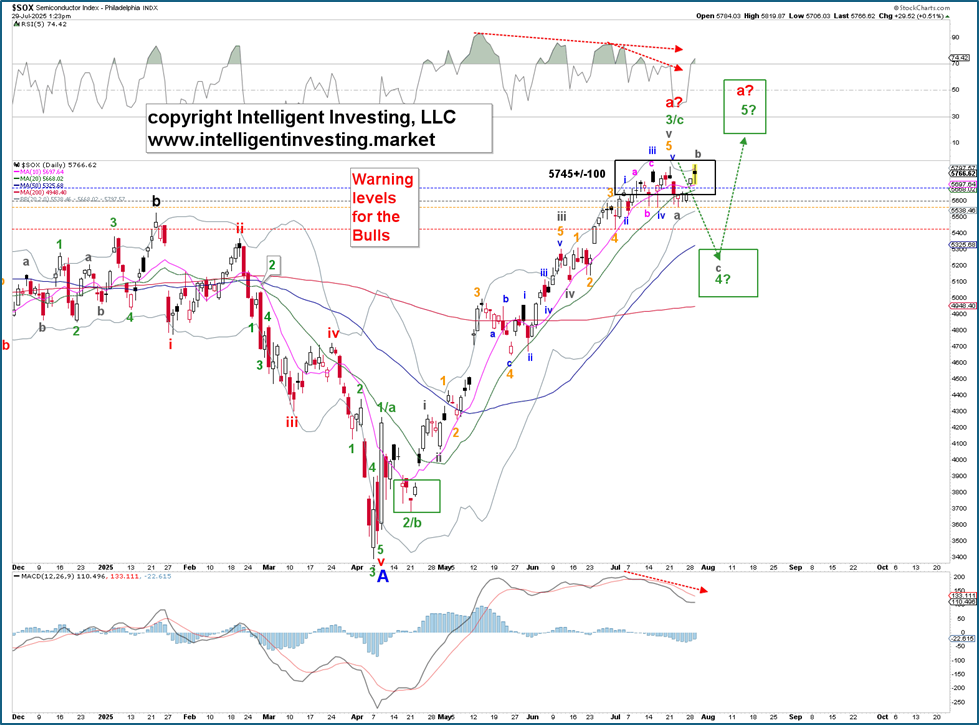
There are now enough waves in place to consider the green W-3/c complete, but the index will need to fall below at least the orange, 3rd warning level at $5,564 to strongly suggest that the top is in. Confirmation will come below the red, 4th warning level at $5,429. The blue, 1st, and gray, 2nd, warning levels at $5,695 and $5,601 are meant as “start paying attention” levels. These four levels allow us to stay in the markets as long as possible without selling prematurely, while still giving us the ability to exit before larger corrections happen.
Meanwhile, negative divergences—specifically, higher prices on declining technical indicators (red dotted arrows)—are widespread, suggesting that the rally since the April low is losing strength and momentum and might be about to reverse. However, these are conditions, not trade triggers, even though they seem warning signs.
Thus, the SOX has reached the target zone predicted a month ago, while negative divergences are emerging. It has stalled in a price range where a pullback (the green W-4) could happen with a higher chance. No guarantee, but if it’s going to happen, now is the time. However, price remains the ultimate decision-maker, and if the Bears can't push the price below at least $5,601, the Bulls can enjoy their rally a bit longer.
Author

Dr. Arnout Ter Schure
Intelligent Investing, LLC
After having worked for over ten years within the field of energy and the environment, Dr.


