Is the road to SP500’s 6,400-6,500 in jeopardy?

Using the Elliott Wave (EW), we have successfully tracked the most likely path forward for the SP500 (SPX) over several months. Although there are many ways to navigate the markets and to each their own, we find the EWP to be the most reliable and accurate. Namely, already in November last year, we found
“Ending Diagonals (EDs) are tricky because all their waves (i-ii-iii-iv-v) comprise three waves: 3-3-3-3-3 = abc-abc-abc-abc-abc. Besides, W-iii typically targets the 123.60% extension of W-i, measured from W-ii. The W-iv then tends to correct back to the 61.80% extension, after which the last W-v targets the 161.80% extension. In this case, we are looking at W-iii to reach at least SPX6060, W-iv should bottom around SPX5725, and W-v can reach at least SPX6260.”
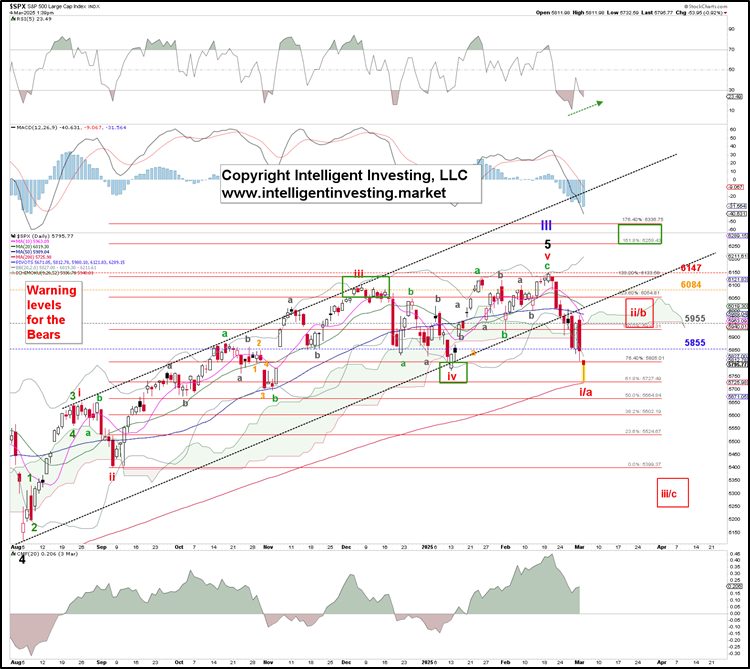
(Red) W-iii topped December 6 at $6099, and (red) W-iv may have bottomed out on January 13 at SPX5773, while (red) W-v only reached $6147 on February 19. See Figure 1 below. The former two waves reached their ideal Fibonacci-based target zones (green squares) for an ED, whereas the latter fell well short of it (blue target zone). Therefore, our previous update unfortunately wholly missed the mark. It shows one cannot be always right, and after such a long streak of being on point, a miss is to be expected at some stage.
Figure 1. Alternate Elliott Wave count for the SP500
However, we were humble enough to recognize that
“we must keep our Bullish stance until proven otherwise. What would that be? A break below the 3rd (orange) warning level -The February 3 low- at $6003 for starters, but ultimately, the January 13 low at $5773 remains the Bull-Bear line in the sand. Our preferred EW count is wrong if the market moves below these levels.”
As such, the break below $6003 already warned us and our premium members ahead of time of worse things to come. That said, let's go back to the current price action. Although price is the final arbiter, and the markets do not owe us anything, i.e., they do not have to reach ideal target zones, such a big miss is uncommon and troubling for this potential wave count.
As such, the index is more likely to complete an irregular expanded flat in EWP terms: W>c>b>a. See Figure 2 below. Besides, the index came within 5p of the ideal 61.80% extension of red W-i, measured from red W-ii, at today’s low, which is as close to the perfect target as possible for a 4th wave in an ED, and coincidentally coincides with the (red) 200-day simple moving average.
Figure 2. Preferred Elliott Wave count for the SP500
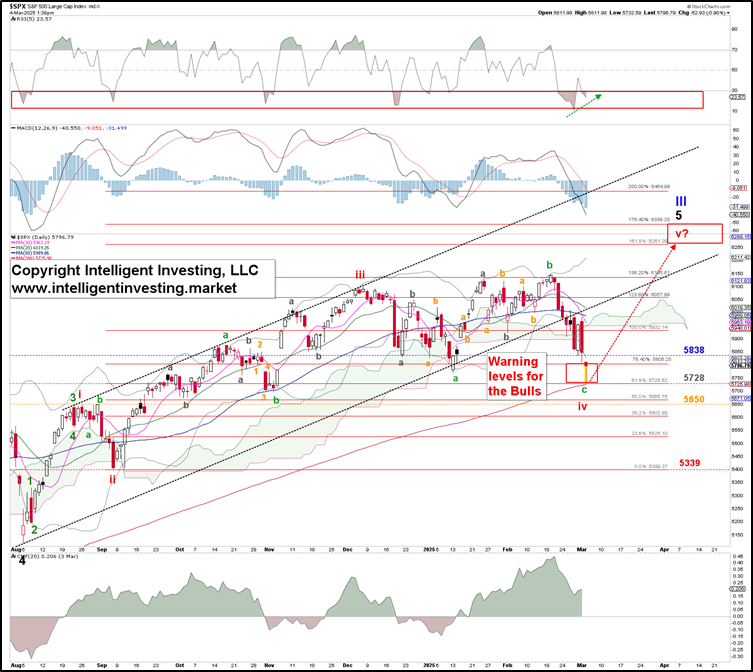
If the index can hold today’s low, especially the (orange) $5650 level, we can look forward to ideally the (red) 161.80% Fib-extension at $6260.
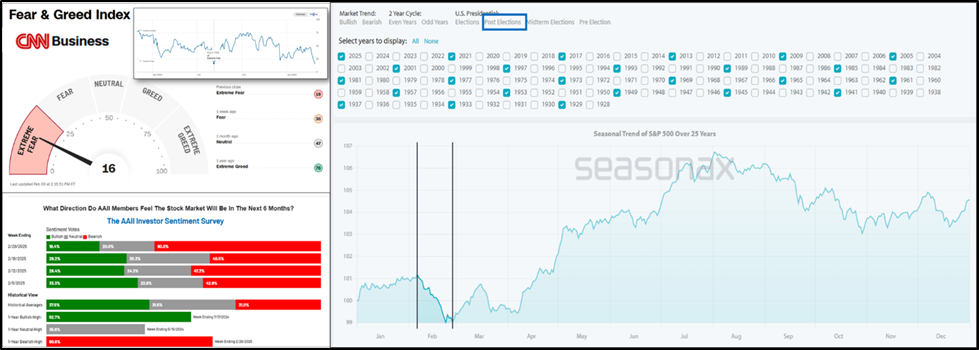
Lastly, sentiment has become highly bearish even though the index made an all-time high less than two weeks ago and has only lost ~6.8% top-to-bottom. Meanwhile, seasonality is turning bullish. See Figure 3 below. Last week’s AAII’s bearish sentiment, expectations that stock prices will fall over the next six months, was 60.6%, which is unusually high and is above its historical average of 31.0% for the 13th time in 15 weeks. It was last higher on September 29, 2022, (60.8%) and was the seventh-highest reading in the survey’s history! CNN’s Fear and Greed Index has been below 25, which is extreme fear territory, for over a week now. However, the average seasonality during the post-US election years shows that the SP500 tends to bottom out around late February.
Figure 3. Sentiment and seasonality
Although these conditions are not trade triggers, and seasonality is only an average, it aligns with our “irregular expanded flat” W-iv EWP count. Thus, our Elliott Wave analysis provides specific levels to watch. How the market reacts to those combined with the structure of that reaction will tell us how to adjust if needed: all we can do is anticipate, monitor, and adjust if necessary. Our preferred EW count went off track, but as we stated last, “we’re simply monitoring its progress to see if it aligns with the market’s price action. If yes, stay long and keep monitoring. If not, adjust and take appropriate trading action.”
Over the last weeks, we monitored the index, found it started to diverge from our preferred EWP count, and adjusted accordingly. As such, we must also lower the ideal upside target from $6400-6500 to $6260. Thus, now the Bulls have a last chance to reach that level. However, once reached, a much larger correction can start, if not an outright multi-year Bear market.
Author

Dr. Arnout Ter Schure
Intelligent Investing, LLC
After having worked for over ten years within the field of energy and the environment, Dr.


