Is the pullback behind us or still looming? Let's investigate [Video]
![Is the pullback behind us or still looming? Let's investigate [Video]](https://editorial.fxstreet.com/images/Markets/Equities/DowJones/dow-jones-stock-indexes-7184580.jpg)
Watch the video extracted from the live session on 8 Aug 2023 below to find out the following:
-
The significance of bearish and change of character bars in determining market pullbacks.
-
The importance of volume and supply levels in confirming pullbacks and potential bounce points.
-
The current market trends and potential support and resistance levels for Nasdaq, Russell 2000, and Dow Jones.
-
Comparison of the supply level among S&P 500, Nasdaq and Russell 2000.
-
And a lot more.
The confirmation bar showed up as discussed in the video to kick-start the pullback. It is essential to judge the characteristics of the test as illustrated in the video in various scenarios to anticipate the next move.
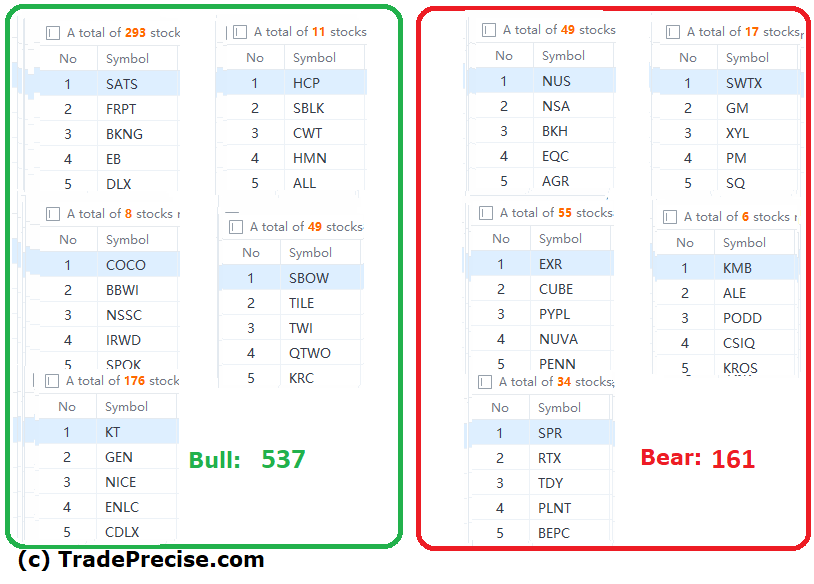
The bullish vs. bearish setup is 537 to 161 from the screenshot of my stock screener below pointing to a positive market environment. However, the 4 market breadth confirms the pullback is still unfolding.
9 “low hanging fruits” (MHO, ETN, etc…) trade entries setup + 29 others (MNSO, PSTG, etc…) plus 19 “wait and hold” candidates have been discussed during the live session.
Easy Way To Identify Outperforming Stocks
Here is 1 easy way for you to identify outperforming stocks without spending any money on sophisticated software or AI.
-
Identify when the market (e.g. S&P 500 or Nasdaq) starts to pullback
-
Compare the stock with the market during the same period to judge if the stock performs better or worse.
Check out the example below comparing MHO and S&P 500.
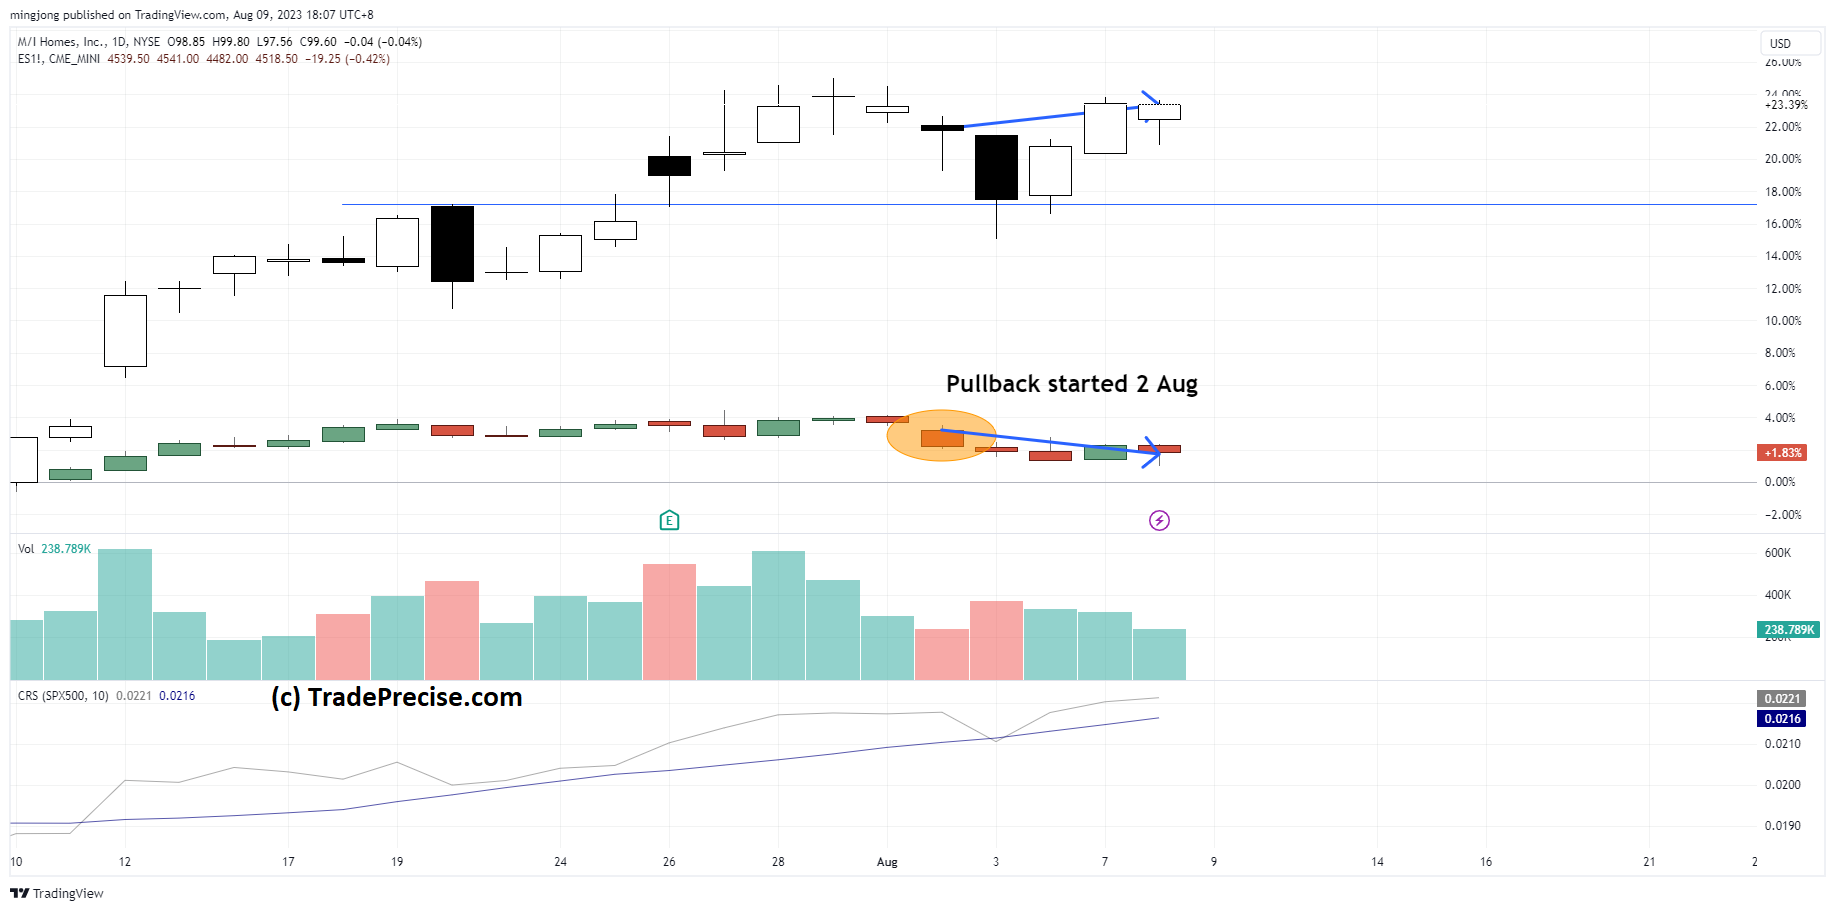
The pullback started on 2 Aug 2023. MHO managed to climb higher while S&P 500 still dive lower, as illustrated in the blue arrow. This shows that MHO outperforms the S&P 500.
When the market stops going down, consolidates or even bounces up, the outperforming stock will likely charge up more than the market.
So do take the chance to spot the outperforming stocks now and form your trading plan so that you can reap big during the next swing up.
Author

Ming Jong Tey
Independent Analyst
Ming Jong Tey has been trading since 2008. He started his learning journey from technical analysis (indicators, Fibonacci, etc...) to value investing. Throughout his journey, he develops an interest in price action with chart pattern trading.


