Is SoFi Technologies (SOFI) set for major breakout? [Video]
![Is SoFi Technologies (SOFI) set for major breakout? [Video]](https://editorial.fxsstatic.com/images/i/wall-street-01_XtraLarge.jpg)
SoFi Technologies, Inc., (SOFI) provides various financial services in the US, Latin America, Canada & Hong Kong. It operates through three segments; Lending, Technology Platform & Financial services. It comes under Financial Services sector & trades as “SOFI” ticker at Nasdaq.
SOFI is showing 5 swings higher from December-2022 low as the part of impulse sequence. It appears to be nesting from 2022 low or can be diagonal, which need more data to confirm the structure. We like to buy the correction in 3, 7 or 11 swings at extreme area in any case.
SOFI – Elliott Wave latest weekly view
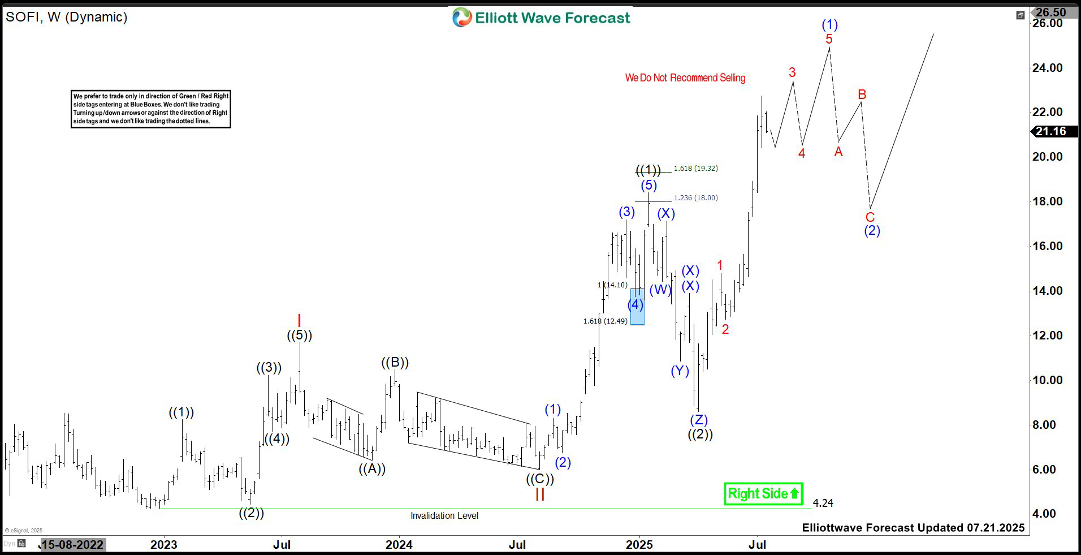
It made all time high of $28.26 in early 2021 & made low of $4.24 in December-2022. Above there, it favors rally in (1) of ((3)) of III from 4.07.2025 low. It placed I at $11.70 high in diagonal sequence in July-2023 & II as zigzag correction at $6.01 low in August-2024 as 0.764 Fibonacci retracement. Above there, it rallied higher in ((1)) of III. It ended ((1)) at $18.42 high in January-2025 & ((2)) at $8.60 low in April-2025. Within ((1)), it placed (1) at $8.30 high, (2) at $6.75 low, (3) at $17.19 high as extended wave, (4) at $13.60 low & finally (5) at $18.42 high as ((1)).
Wave ((2)) was corrected in 11 swings as triple three correction. Within ((2)), it placed (W) at $14.42 low, (X) at $17.11 high, (Y) at $10.85 low, (XX) at $13.90 high & (Z) at $8.60 low. Above ((2)) low, it already confirmed bullish view in nest which confirms when erase the momentum divergence. It favors rally in (1) of ((3)) & expect continuation against 5.21.2025 low. Within (1), it placed 1 at $14.78 high, 2 at $12.74 low as shallow pullback & favor upside in 3. Within 1, it ended ((i)) at $11.65 high, ((ii)) at $10.07 low, ((iii)) at $14.51 high, ((iv)) at $12.05 low & ((v)) at $14.78 high.
SOFI – Elliott Wave latest daily view
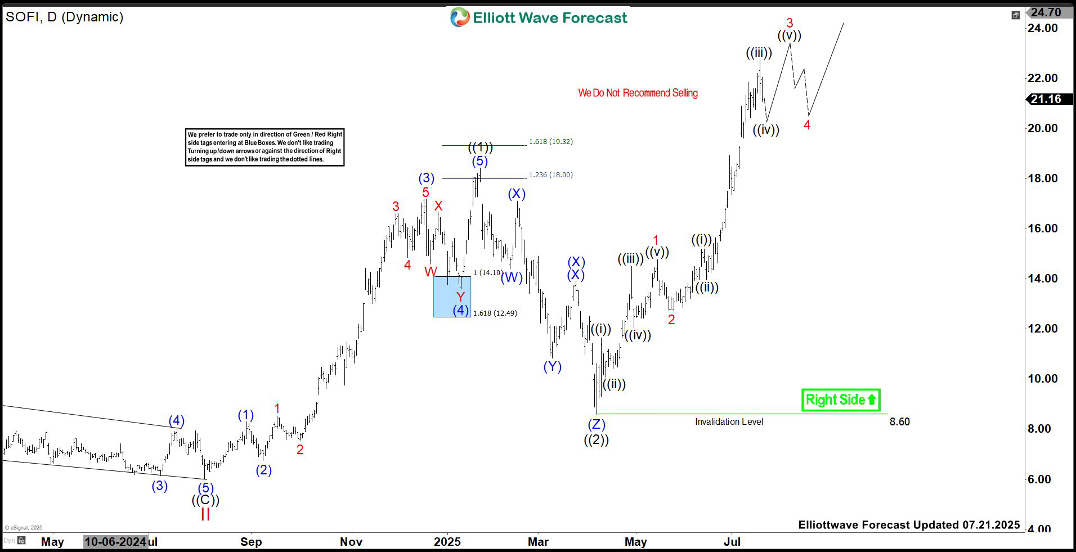
It proposed ended ((iii)) of 3 at $22.74 high & correcting in ((iv)) in 3 or 7 swings against 6.13.2025 low before resume higher in to finish 3. Wave ((iv)) may pullback in to $20.68 – $19.39 area before it should extend higher in ((v)) of 3. It expects two more highs to finish the (1) sequence from April-2025 low. Alternatively, it may end 3 at last peak & could pullback in 4 in to $20.41 – $18.95 area before final push higher to finish (1). So, it expects at least one or two more highs to end cycle from April-2025 low. We like to buy the pullback in 3, 7 or 11 swings in 4 & later in (2) against April-2025 low for next leg higher.
Author

Elliott Wave Forecast Team
ElliottWave-Forecast.com


