|

Invesco Nasdaq ETF ($QQQ) found buyers at the blue box area as expected

In today’s article, we will look at the past performance of the 1H Hour Elliott Wave chart of Invesco Nasdaq ETF ($QQQ). The rally from 1.17.2024 low at $402.87 unfolded as 5 waves impulse. So, we expected the pullback to unfold in 3 swings and find buyers again. We will explain the structure & forecast below:

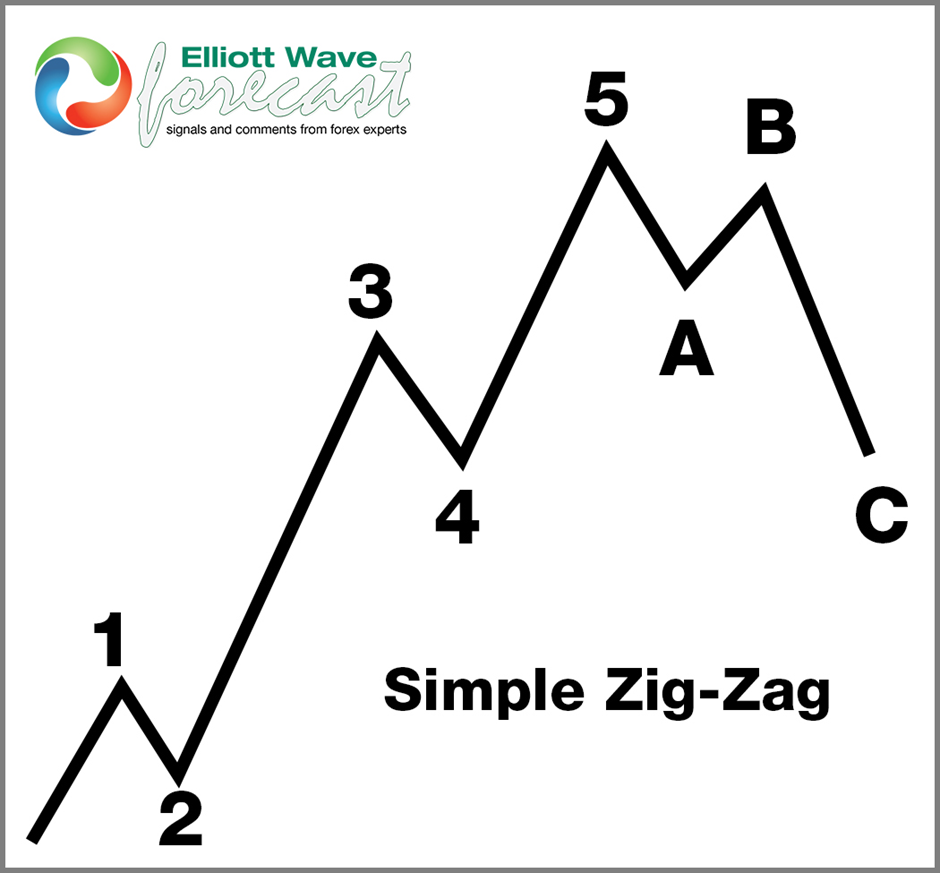
Zigzag (ABC) corrective structure

Chart

$QQQ one hour Elliott Wave chart 1.31.2024

Chart

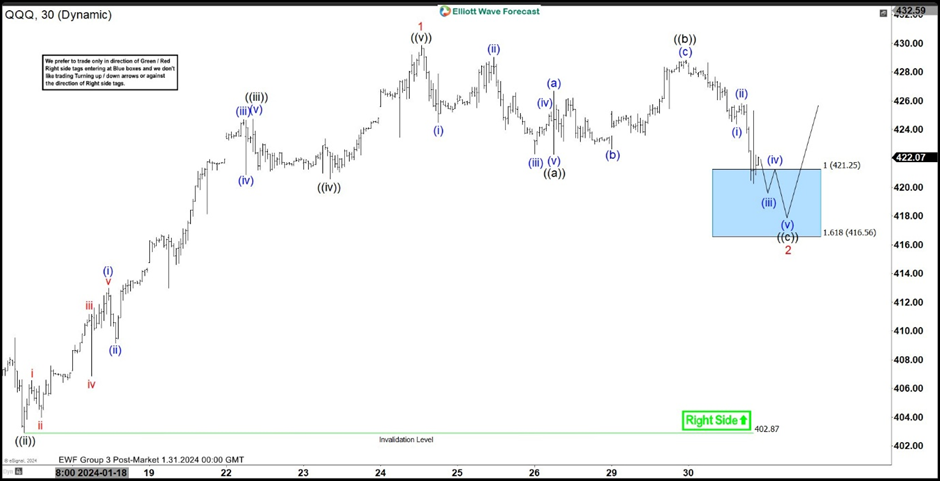
Here is the 1H Elliott Wave count from 1.31.2024. We expected the pullback to find buyers at the blue box area at 421.25 – 416.56 in a 3 swing structure (ABC).

$QQQ one hour Elliott Wave chart 2.04.2024

Chart

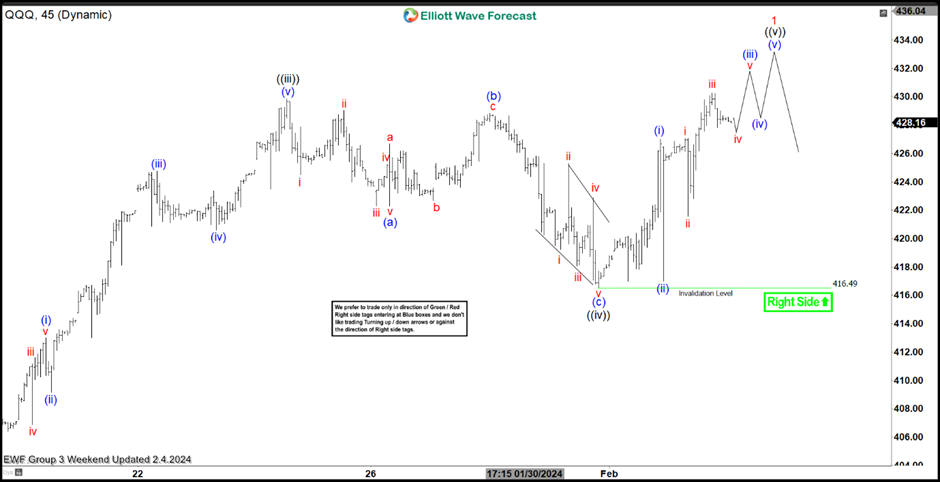
Here is the 1H update few days later from 2.04.2024 showing the bounce taking place as expected. The ETF reacted higher from the blue box after doing a Zigzag correction allowing longs to get a risk free position. The ETF has made a marginal new high and is expected to remain supported towards $438 – 446 before another pullback can happen.

Author

Elliott Wave Forecast Team

Elliott Wave Forecast Team

ElliottWave-Forecast.com

More from Elliott Wave Forecast Team
Share:

Markets move fast. We move first.

Orange Juice Newsletter brings you expert driven insights - not headlines. Every day on your inbox.

By subscribing you agree to our Terms and conditions.

Editor's Picks

EUR/USD clings to small gains near 1.1750

Following a short-lasting correction in the early European session, EUR/USD regains its traction and clings to moderate gains at around 1.1750 on Monday. Nevertheless, the pair's volatility remains low, with investors awaiting this weeks key data releases from the US and the ECB policy announcements.

GBP/USD edges higher toward 1.3400 ahead of US data and BoE

GBP/USD reverses its direction and advances toward 1.3400 following a drop to the 1.3350 area earlier in the day. The US Dollar struggles to gather recovery momentum as markets await Tuesday's Nonfarm Payrolls data, while the Pound Sterling holds steady ahead of the BoE policy announcements later in the week.

Gold stuck around $4,300 as markets turn cautious

Gold loses its bullish momentum and retreats below $4,350 after testing this level earlier on Monday. XAU/USD, however, stays in positive territory as the US Dollar remains on the back foot on growing expectations for a dovish Fed policy outlook next year.

Solana consolidates as spot ETF inflows near $1 billion signal institutional dip-buying

Solana price hovers above $131 at the time of writing on Monday, nearing the upper boundary of a falling wedge pattern, awaiting a decisive breakout. On the institutional side, demand for spot Solana Exchange-Traded Funds remained firm, pushing total assets under management to nearly $1 billion since launch. 

Big week ends with big doubts

The S&P 500 continued to push higher yesterday as the US 2-year yield wavered around the 3.50% mark following a Federal Reserve (Fed) rate cut earlier this week that was ultimately perceived as not that hawkish after all. The cut is especially boosting the non-tech pockets of the market.

Solana Price Forecast: SOL consolidates as spot ETF inflows near $1 billion signal institutional dip-buying

Solana (SOL) price hovers above $131 at the time of writing on Monday, nearing the upper boundary of a falling wedge pattern, awaiting a decisive breakout.