Indian Rupee weakens amid surging Oil prices, India's CPI rises strongly
- The Indian Rupee declines to an over six-week low at around 95.70 against the US Dollar due to multiple headwinds.
- Surging Oil prices could push the Indian Rupee to an all-time low at around 97.10 against the US Dollar.
- Investors await the US CPI data for June and Fed Chair Warsh's testimony.

The Indian Rupee (INR) trades significantly lower against the US Dollar (USD) on Monday. The USD/INR jumps to over a six-week high around 95.70 as renewed Middle East hostilities have strengthened oil prices.
In India's afternoon trading session, the MCX Crude Oil contract expiring on July 20 is up 2.4% to near Rs. 6,980.
Currencies from economies, such as India, which rely heavily on oil imports to meet their energy needs, tend to underperform in a high oil price environment.
US strikes over 300 Iranian targets in the last three days
Earlier in the day, the US Central Command (CENTCOM) reported that forces had already struck more than 300 Iranian targets over three nights, including 140 on Saturday alone, per Reuters. The Iranian media has also confirmed several explosions near Sirik, west of Bandar Abbas, Qeshm, and Jask. US forces also stated that strikes were aimed to cripple Iran’s ability to attack civilian ships in the Strait of Hormuz, a critical chokepoint to almost 20% of the global energy supply.
In the wake of renewed aggression between the US and Iran, the appeal of safe-haven assets has improved.
As part of retaliation, Iran announced over the weekend that the Hormuz would now be closed “until further notice”.
India's CPI rises strongly in June
On the domestic front, India's retail Consumer Price Index (CPI) data arrives at 4.38% Year-on-Year (YoY) in June, higher than 4.3% estimates and the May reading of 3.93%. Signs of rising inflationary pressures would prompt expectations of interest rate hikes by the Reserve Bank of India (RBI).
This week, investors will also focus on the US inflation data for June, which is scheduled to be released on Tuesday. The US core CPI – which excludes volatile food and energy items such as food and energy – is seen rising at a steady pace of 2.9% YoY.
Apart from the US CPI data, investors will also pay attention to comments from Federal Reserve (Fed) Chair Kevin Warsh in his two-day testimony before the Treasury Committee, which will start on Tuesday.
FIIs invested a significant amount on Friday
Foreign Institutional Investors (FIIs) remained net buyers in the Indian stock market on Friday, investing a significant amount of Rs. 2,603.72 crore. This is the highest one-day buying seen since June 19.
The interest of foreign investors in the Indian equity market seems to be improving in the past few weeks with the kickstart of the first quarter earnings season of FY2026-27. So far in July, foreign investors have remained net buyers in five out of eight trading sessions.
Analysts at Goldman Sachs see ample room for foreign flows to return to India, clarifying that India's outlook has improved in recent weeks amid lower commodity prices, a stable currency, resilient domestic growth, and healthy earnings expectations. The investment banking firm expects reasonably valued pockets like large-caps and banks will likely gain the most if the foreign outflows reverse course.
Technical Analysis: USD/INR holds Descending Triangle breakout
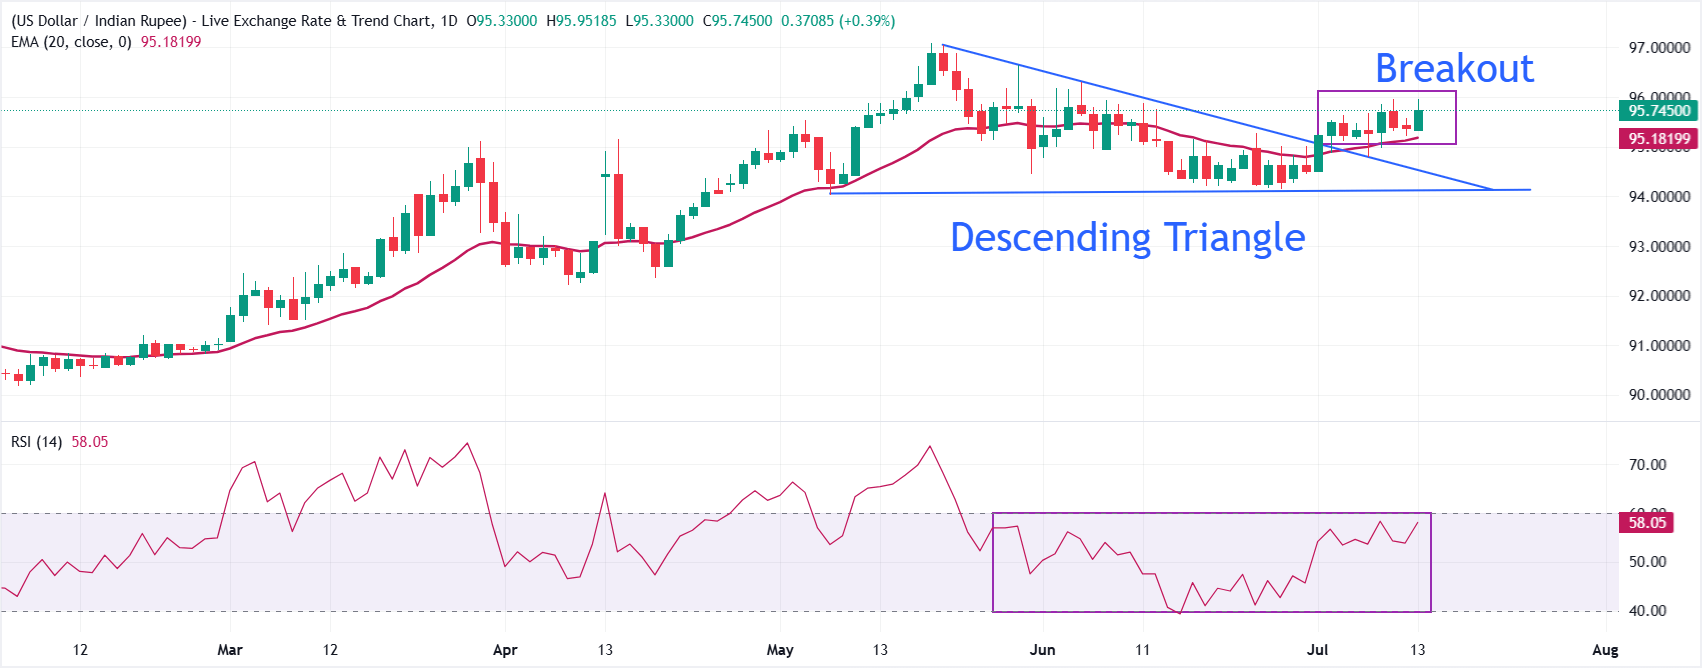
USD/INR trades higher at around 95.70, keeping a constructive near-term bias as it holds well above the 20-day Exponential Moving Average (EMA) at 95.18. The pair also holds the breakout of the Descending Triangle formation.
The Relative Strength Index (RSI) at 58.05 leans toward bullish momentum without yet signaling overbought conditions, suggesting buyers remain in control.
On the downside, initial support is seen at the 20-day EMA near 95.18, which lines up with the short-term bullish trend and could attract dip-buying interest. A deeper pullback would expose the former downtrend break zone around 94.50, ahead of the rising trend-line region between roughly 94.12 and 94.06, where a loss of this band would undermine the current bullish tone and open the door to a more pronounced correction.
Looking up, the pair would attempt to revisit the all-time high around 97.10 if it manages to break above the July 9 high at 95.96.
(The technical analysis of this story was written with the help of an AI tool. Know more.)
Economic Indicator
Consumer Price Index (YoY)
The India Consumer Price Index released by the Ministry of Statistics and Programme Implementation measures the average price change for all goods and services purchased by households for consumption purposes. CPI is the main indicator to measure inflation and changes in purchasing trends. A high reading is positive (or bullish) for the INR, while a low reading is negative (or bearish).
Read more.Last release: Mon Jul 13, 2026 10:30
Frequency: Monthly
Actual: 4.38%
Consensus: 4.3%
Previous: 3.93%
Author

Sagar Dua
FXStreet
Sagar Dua is associated with the financial markets from his college days. Along with pursuing post-graduation in Commerce in 2014, he started his markets training with chart analysis.
















