|

IBEX Elliott Wave analysis: Buyers profit from the blue box

In early August of this year, stock market indices saw significant declines across the board. Once again, so-called experts started predicting doom. However, we maintained the same outlook we’ve held for months. Our members at Elliottwave Forecast understood our position. We consistently believed that indices should remain within the long-term bullish cycle. We anticipated counter moves would develop as corrective pullbacks in a sequence of 3, 7, or 11 swings. These pullbacks should end at the equal leg, setting up for the next rally. And that’s precisely what happened. Major indices hit their extremes on August 5th, 2024, ending the corrective pullback that began in June 2024 with 3, 7, or 11 swings.

Prices have since recovered from the sharp early August decline. While the experts spread fear, we encouraged our traders to buy indices at the extremes. The IBEX 35 was one of the indices our members successfully traded.

IBEX 35 H4 chart 08.03.2024

Chart

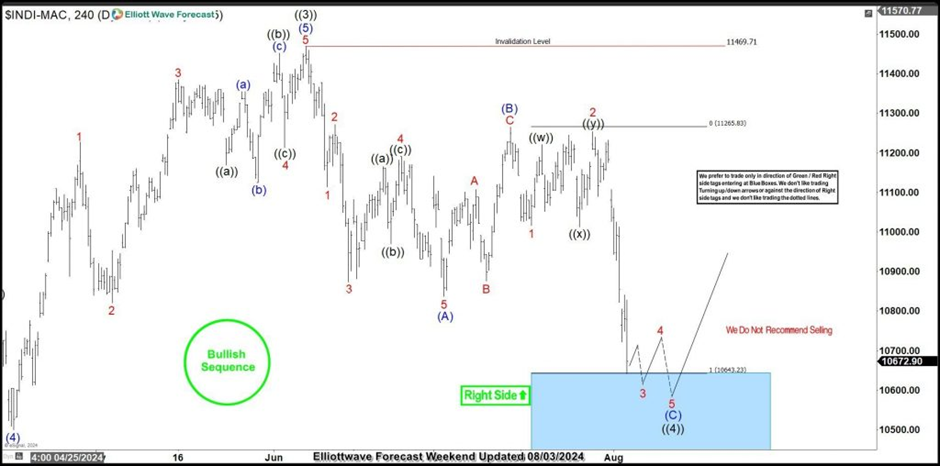
We shared the IBEX 35 H4 chart with members on August 3rd, 2024. The decline from the June 2024 high was completing a zigzag structure. We identified the extreme zone at 10,643 to 10,260 with a blue box. Members entered LONG positions within the blue box, with stops placed below 10,260. Although we found the initial LONG entry using the H4 chart, we continued managing the shorter cycles on the H1 chart several times a day.

IBEX 35 H4 chart 08.21.2024

Chart

The chart above shows how the IBEX 35 found fresh buyers in the blue box. We shared this chart with members on August 21st, 2024. The rally advanced with an impulse structure, reaching a risk-free zone. The end of wave ((4)) is now confirmed. We identify the impulse rally from the blue box as wave (1) of ((5)). A pullback in wave (2) is expected to hold above the 10,297.99 invalidation level. Afterward, the long-term bullish trend should resume. Therefore, we aim to remain buyers from the extremes of 3, 7, or 11 swings pullbacks across all the indices we cover.

Author

Elliott Wave Forecast Team

Elliott Wave Forecast Team

ElliottWave-Forecast.com

More from Elliott Wave Forecast Team
Share:

Markets move fast. We move first.

Orange Juice Newsletter brings you expert driven insights - not headlines. Every day on your inbox.

By subscribing you agree to our Terms and conditions.

Editor's Picks

EUR/USD drops to daily lows near 1.1630

EUR/USD now loses some traction and slips back to the area of daily lows around 1.1630 on the back of a mild bounce in the US Dollar. Fresh US data, including the September PCE inflation numbers and the latest read on December consumer sentiment, didn’t really move the needle, so the pair is still on course to finish the week with a respectable gain.

GBP/USD trims gains, recedes toward 1.3320

GBP/USD is struggling to keep its daily advance, coming under fresh pressure and retreating to the 1.3320 zone following a mild bullish attempt in the Greenback. Even though US consumer sentiment surprised to the upside, the US Dollar isn’t getting much love, as traders are far more interested in what the Fed will say next week.

Gold makes a U-turn, back to $4,200

Gold is now losing the grip and receding to the key $4,200 region per troy ounce following some signs of life in the Greenback and a marked bounce in US Treasury yields across the board. The positive outlook for the precious metal, however, remains underpinned by steady bets for extra easing by the Fed.

Crypto Today: Bitcoin, Ethereum, XRP pare gains despite increasing hopes of upcoming Fed rate cut

Bitcoin is steadying above $91,000 at the time of writing on Friday. Ethereum remains above $3,100, reflecting positive sentiment ahead of the Federal Reserve's (Fed) monetary policy meeting on December 10.

Week ahead – Rate cut or market shock? The Fed decides

Fed rate cut widely expected; dot plot and overall meeting rhetoric also matter. Risk appetite is supported by Fed rate cut expectations; cryptos show signs of life. RBA, BoC and SNB also meet; chances of surprises are relatively low.

Ripple faces persistent bear risks, shrugging off ETF inflows

Ripple is extending its decline for the second consecutive day, trading at $2.06 at the time of writing on Friday. Sentiment surrounding the cross-border remittance token continues to lag despite steady inflows into XRP spot ETFs.