IBEX 35 (Spain) index Elliott Wave technical analysis [Video]
![IBEX 35 (Spain) index Elliott Wave technical analysis [Video]](https://editorial.fxsstatic.com/images/i/General-Stocks_2_XtraLarge.png)
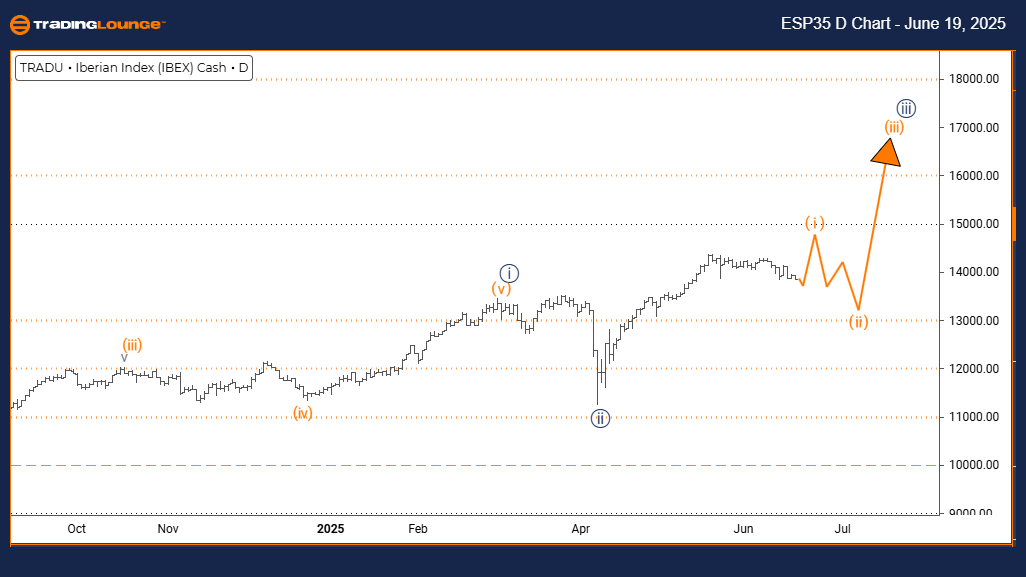
IBEX 35 (Spain) Wave technical analysis
Function: Bullish Trend.
Mode: Impulsive.
Structure: Orange Wave 1.
Position: Navy Blue Wave 3.
Direction next lower degrees: Orange Wave 2.
Details: Navy Blue Wave 2 appears completed. Orange Wave 1 of 3 is now active.
The daily chart Elliott Wave analysis for IBEX 35 (Spain) suggests a bullish trend. Current price action is impulsive, indicating upward strength. The wave formation shows Orange Wave 1 in progress, which is part of a broader Navy Blue Wave 3 structure. This signals the early stages of a potential extended bullish move.
Navy Blue Wave 2 looks to have completed its corrective phase, transitioning into Orange Wave 1 of Navy Blue Wave 3. This phase often begins a strong upward push. The next lower degree movement expected is Orange Wave 2, which typically follows the end of Orange Wave 1 and may involve a mild corrective pullback before resuming the main trend.
Technical analysis suggests that IBEX 35 is well-positioned for a continued rise. With Navy Blue Wave 2 completed and Orange Wave 1 unfolding, the bullish phase appears confirmed. The impulsive setup points to active buying and the likelihood of further gains in the short term.
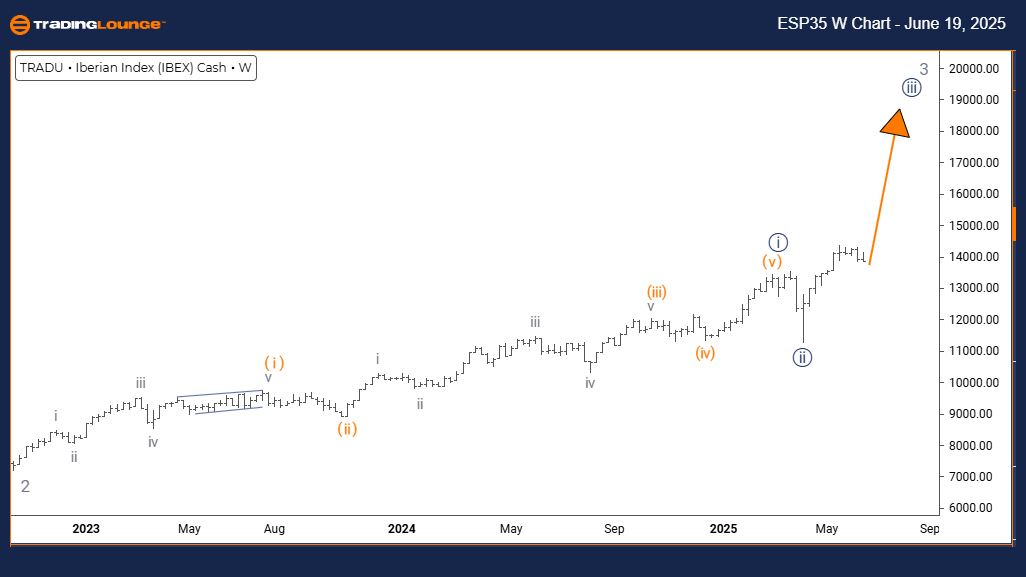
IBEX 35 (Spain) Wave technical analysis
Function: Bullish Trend.
Mode: Impulsive.
Structure: Navy Blue Wave 3.
Position: Gray Wave 3.
Direction next lower degrees: Orange Wave 2.
Details: Navy Blue Wave 2 appears completed. Navy Blue Wave 3 is now active.
The weekly Elliott Wave analysis of IBEX 35 confirms a strong bullish structure. The index is in an impulsive phase, currently forming Navy Blue Wave 3 within the larger Gray Wave 3 pattern. Third waves often represent the most powerful section of an Elliott Wave cycle.
With Navy Blue Wave 2 completing its correction, Navy Blue Wave 3 has started, indicating the beginning of a potentially extended upward move. This part of the wave sequence is usually marked by rapid price gains and limited retracements. The next expected lower degree movement would be Orange Wave 2 once this impulsive segment concludes.
The technical outlook shows IBEX 35 poised for meaningful gains, with Navy Blue Wave 3 in motion. The strength of this wave phase often reflects high institutional demand and strong investor confidence. As it unfolds within Gray Wave 3, the upward momentum may sustain in the medium term.
IBEX 35 (Spain) Wave technical analysis [Video]
Author

Peter Mathers
TradingLounge
Peter Mathers started actively trading in 1982. He began his career at Hoei and Shoin, a Japanese futures trading company.


