IBEX 35 (Spain) index Elliott Wave technical analysis [Video]
![IBEX 35 (Spain) index Elliott Wave technical analysis [Video]](https://editorial.fxstreet.com/images/Markets/Equities/DowJones/bloomberg-app-on-iphone-4-with-market-data-17118657_XtraLarge.jpg)
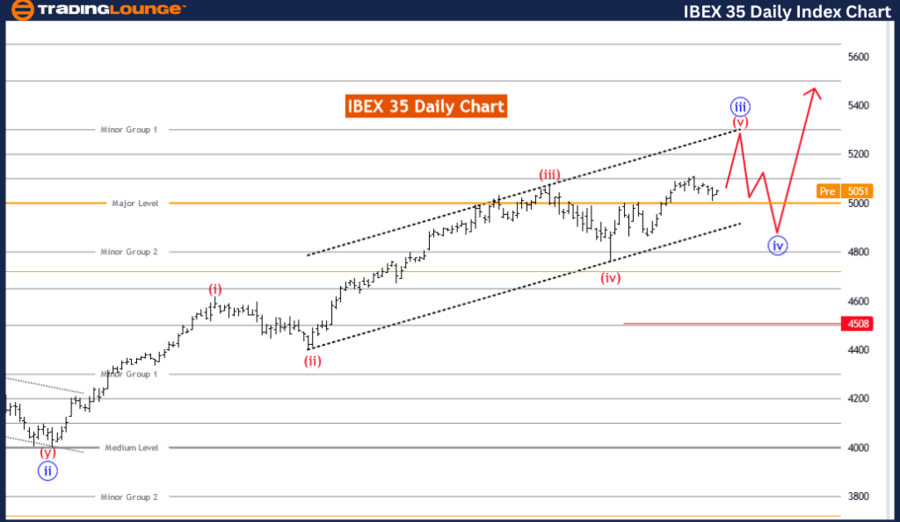
IBEX 35 (Spain) Elliott Wave Analysis Trading Lounge Day Chart,
IBEX 35 (Spain) Elliott Wave technical analysis
Function: Trend
Mode: Impulsive
Structure: Red wave 5
Position: Blue Wave 3
Direction next lower degrees: Blue wave 4
Details: Red wave 4 looking completed at 476. Now red wave 5 of 3 is in play.
Wave Cancel invalid level: 4508
The IBEX 35 Elliott Wave analysis on the daily chart offers insights into the current market trend and its anticipated movements, employing the Elliott Wave theory. This analysis is designed to identify the prevailing trend, which is classified as impulsive. An impulsive trend signifies robust directional movements, characterized by significant price changes that follow the primary market direction.
The focal structure in this analysis is red wave 5, a critical component of the impulsive wave cycle. Within this larger wave structure, the market is positioned in blue wave 3, indicating an ongoing phase of strong market activity. Blue wave 3 is typically associated with substantial price movements and is a key part of the impulsive wave sequence.
Looking forward, the analysis suggests that blue wave 4 is the next direction for the lower degrees. This wave will come after the completion of blue wave 3 and generally involves a corrective phase where the market consolidates recent price movements before resuming the primary trend.
The details provided in the analysis highlight that red wave 4 appears to be completed at a specific price level of 4761. This completion indicates that the market is now in the phase of red wave 5 of blue wave 3, suggesting continued strong market activity as part of the broader impulsive wave structure.
A critical component of this analysis is the wave cancel invalid level, set at a particular price point of 4508. If the market price falls below this level, it would invalidate the current wave count, necessitating a reassessment of the Elliott Wave structure. This invalidation level is crucial for confirming the accuracy of the wave pattern and the projected market direction.
In summary, the IBEX 35 is currently in an impulsive trend on the daily chart, situated within the third wave of the red wave 5 sequence. The market has completed red wave 4 and is now progressing through red wave 5 of blue wave 3. Monitoring the invalidation level is essential to validate the current wave count and accurately predict future market movements.
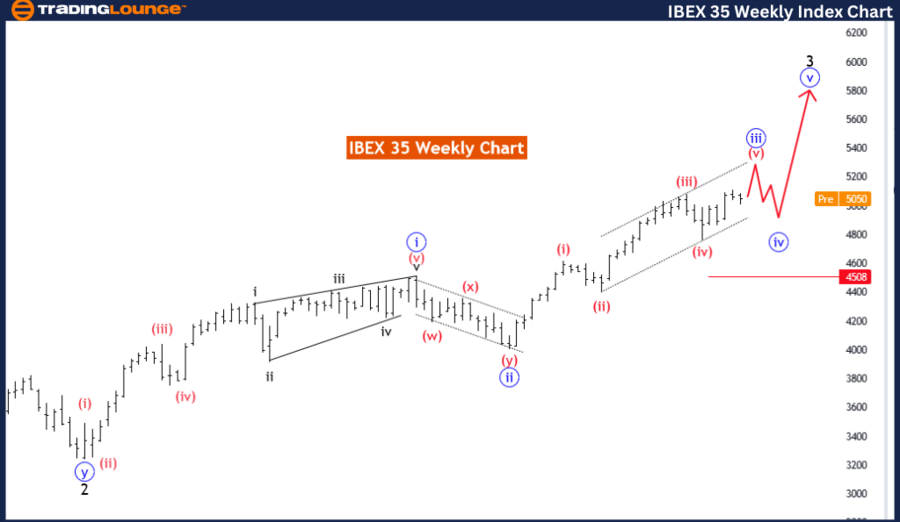
IBEX 35 (Spain) Elliott Wave Analysis Trading Lounge Weekly Chart,
IBEX 35 (Spain) Elliott Wave technical analysis
Function: Trend
Mode: Impulsive
Structure: Blue Wave 3
Position: Black Wave 3
Direction next lower degrees: Blue wave
Details: Blue Wave 3 still is in play, after that blue wave 4 expected.
Wave Cancel invalid level: 4508
The IBEX 35 Elliott Wave analysis on the weekly chart provides a detailed examination of the current trend using the Elliott Wave theory. This analysis identifies the prevailing trend as impulsive, indicating strong and consistent directional market movements. Impulsive trends are characterized by clear, sharp price movements that follow the primary market direction.
The primary structure under consideration is blue wave 3, which is part of a larger impulsive wave sequence. Within this context, the market is currently positioned in black wave 3. This wave represents a significant phase of the impulsive cycle, typically associated with substantial price advances and strong market activity.
Looking ahead, the analysis suggests that blue wave 4 is the next expected movement in the lower degrees of the wave structure. Blue wave 4 usually follows the completion of blue wave 3 and involves a corrective phase where the market consolidates recent gains before continuing the primary trend.
The details provided in the analysis emphasize that blue wave 3 is still actively unfolding, indicating ongoing strong market movements. Once blue wave 3 completes, the market is anticipated to enter blue wave 4, which will involve a period of correction and consolidation.
A crucial aspect of this analysis is the wave cancel invalid level, set at 4508. This level serves as a critical threshold; if the market price drops below this point, it would invalidate the current wave count. This invalidation necessitates a reassessment of the wave structure and the market's projected direction. Monitoring this level is essential to confirm the validity of the wave pattern and ensure accurate market predictions.
In summary, the IBEX 35 is currently in an impulsive trend on the weekly chart, situated within the third wave of blue wave 3. The market is expected to continue through blue wave 3 before transitioning to blue wave 4, a corrective phase. Keeping an eye on the invalidation level is crucial to validate the current wave count and ensure the accuracy of future market forecasts.
Technical analyst: Malik Awais.
IBEX 35 (Spain) Elliott Wave technical analysis [Video]
Author

Peter Mathers
TradingLounge
Peter Mathers started actively trading in 1982. He began his career at Hoei and Shoin, a Japanese futures trading company.


