How we saw CrowdStrike (CRWD Stock) and what to expect in coming months

CrowdStrike Holdings, Inc. (CRWD) is an American cybersecurity technology company based in Austin, Texas. It provides cloud workload and endpoint security, threat intelligence, and cyberattack response services.
CrowdStrike (CRWD) July 2021 daily chart
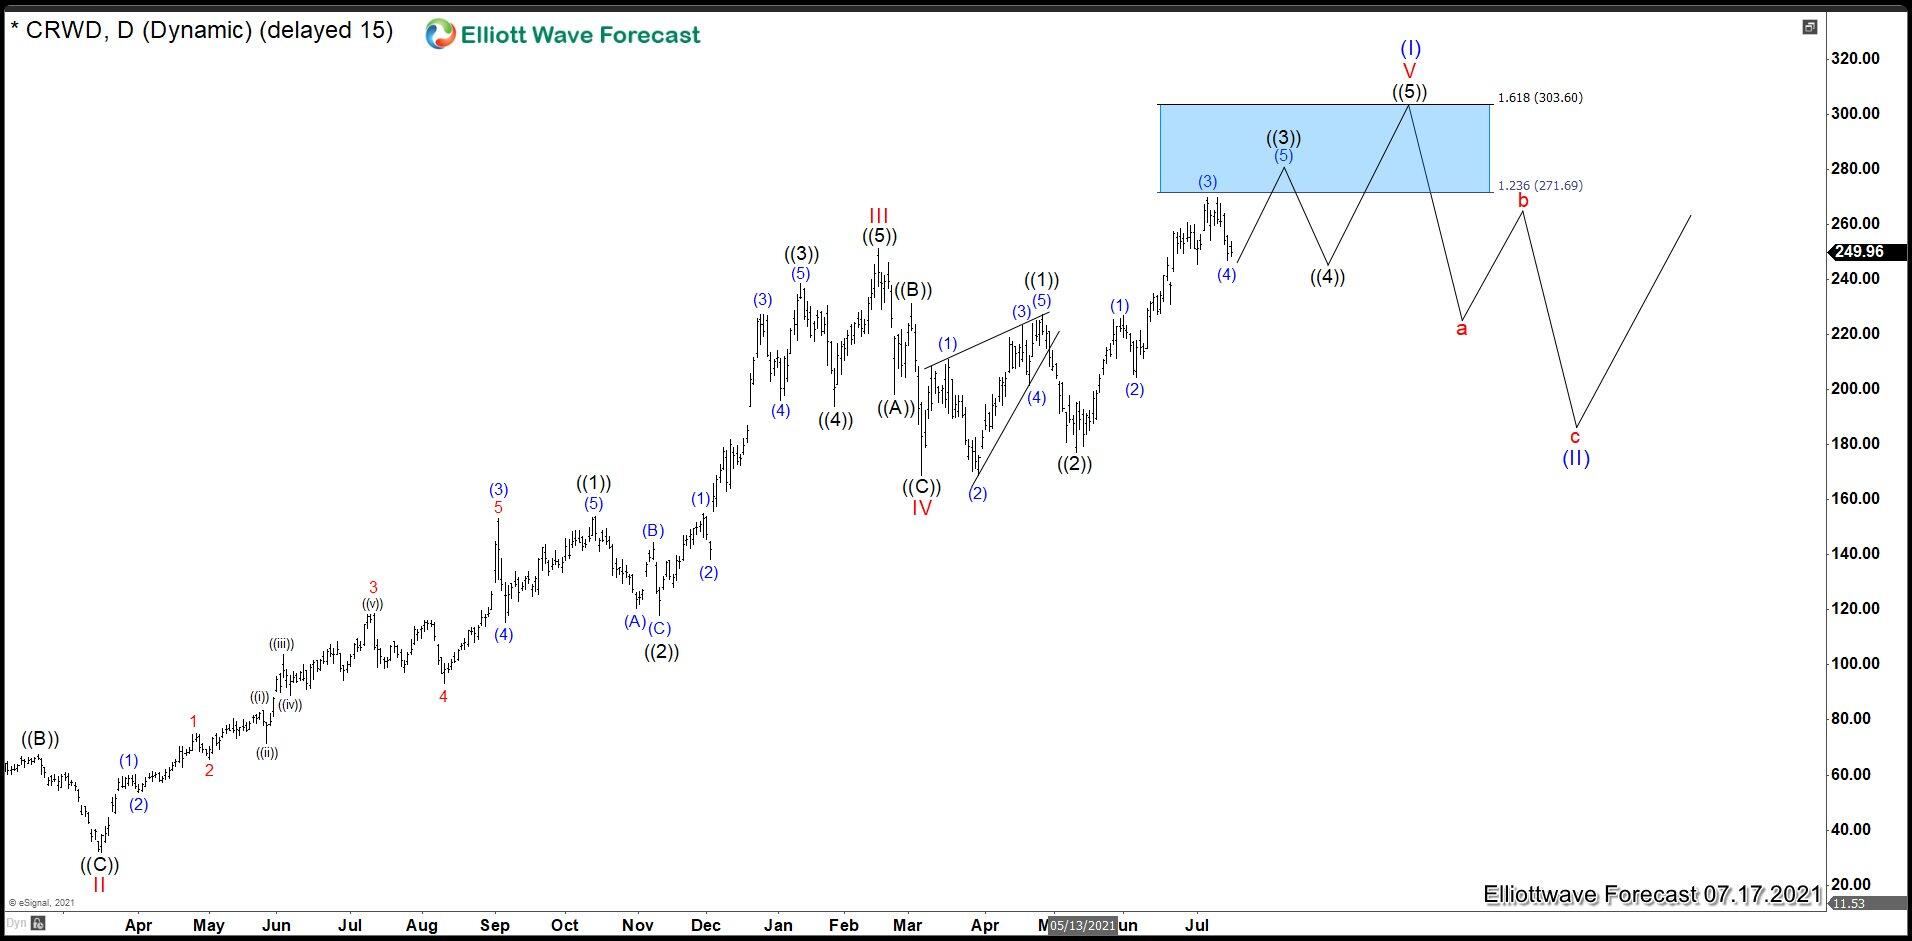
On July 22nd, we analyzed CRWD showing an structure suggesting that a very important market cycle was near to end; that is, the whole cycle from its foundation in 2011. We were expecting to peak after 5 waves up from 168.67 wave IV low and we provided a blue box area in 271.69 – 303.60 as possible zone to finish this Super Cycle and start a huge pullback.
CrowdStrike (CRWD) November 2021 daily chart
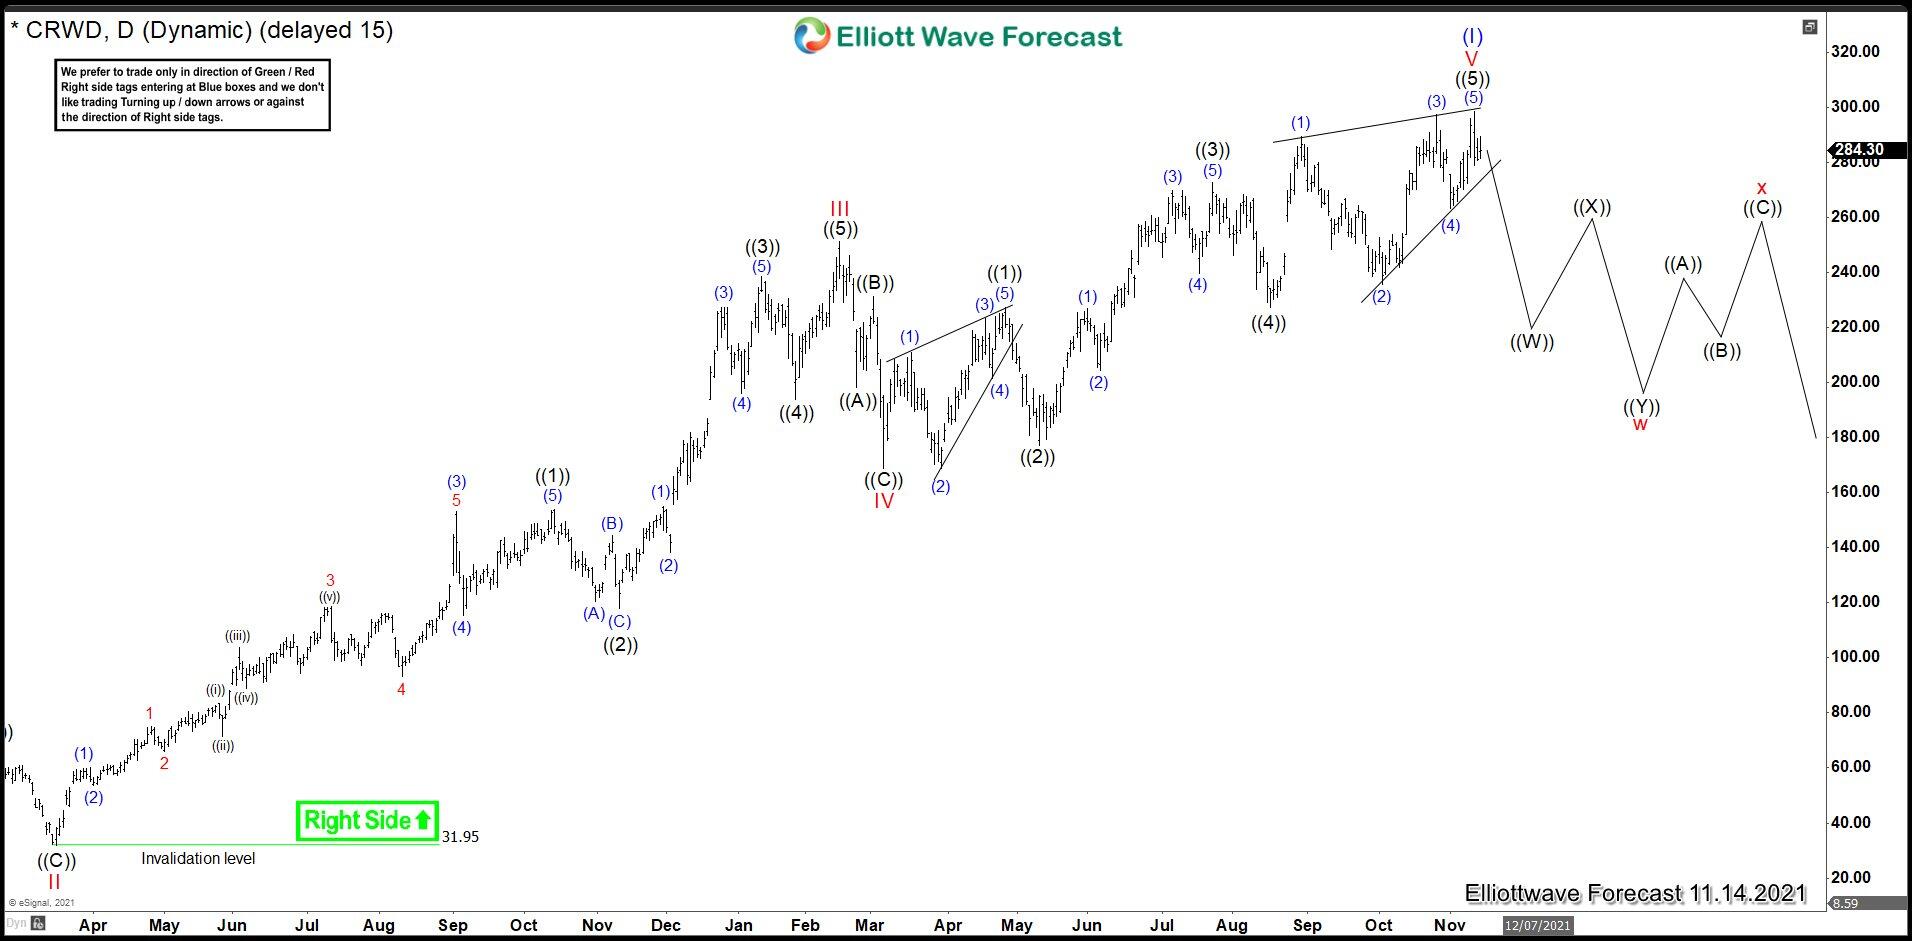
In November, the structure of CRWD had enough swings to think that 5 waves impulse and the Super Cycle had ended. The impulse started with wave I ended at 101.800 on 2019, the wave II pullback finished at 31.95 on March 2020 with the pandemic drop. From there the rally continued and wave III ended at 251.28 and a corrective wave as IV completed at 168.67. In this point, the last push to complete wave V higher began, and as expected CRWD made 5 swings up being the last wave ((5)) of (V) an ending diagonal. The cycle ended at 298.48 inside our possible target area 271.69 – 303.60 and we were expecting a very important drop in the stock.
CrowdStrike (CRWD) December 2021 daily chart
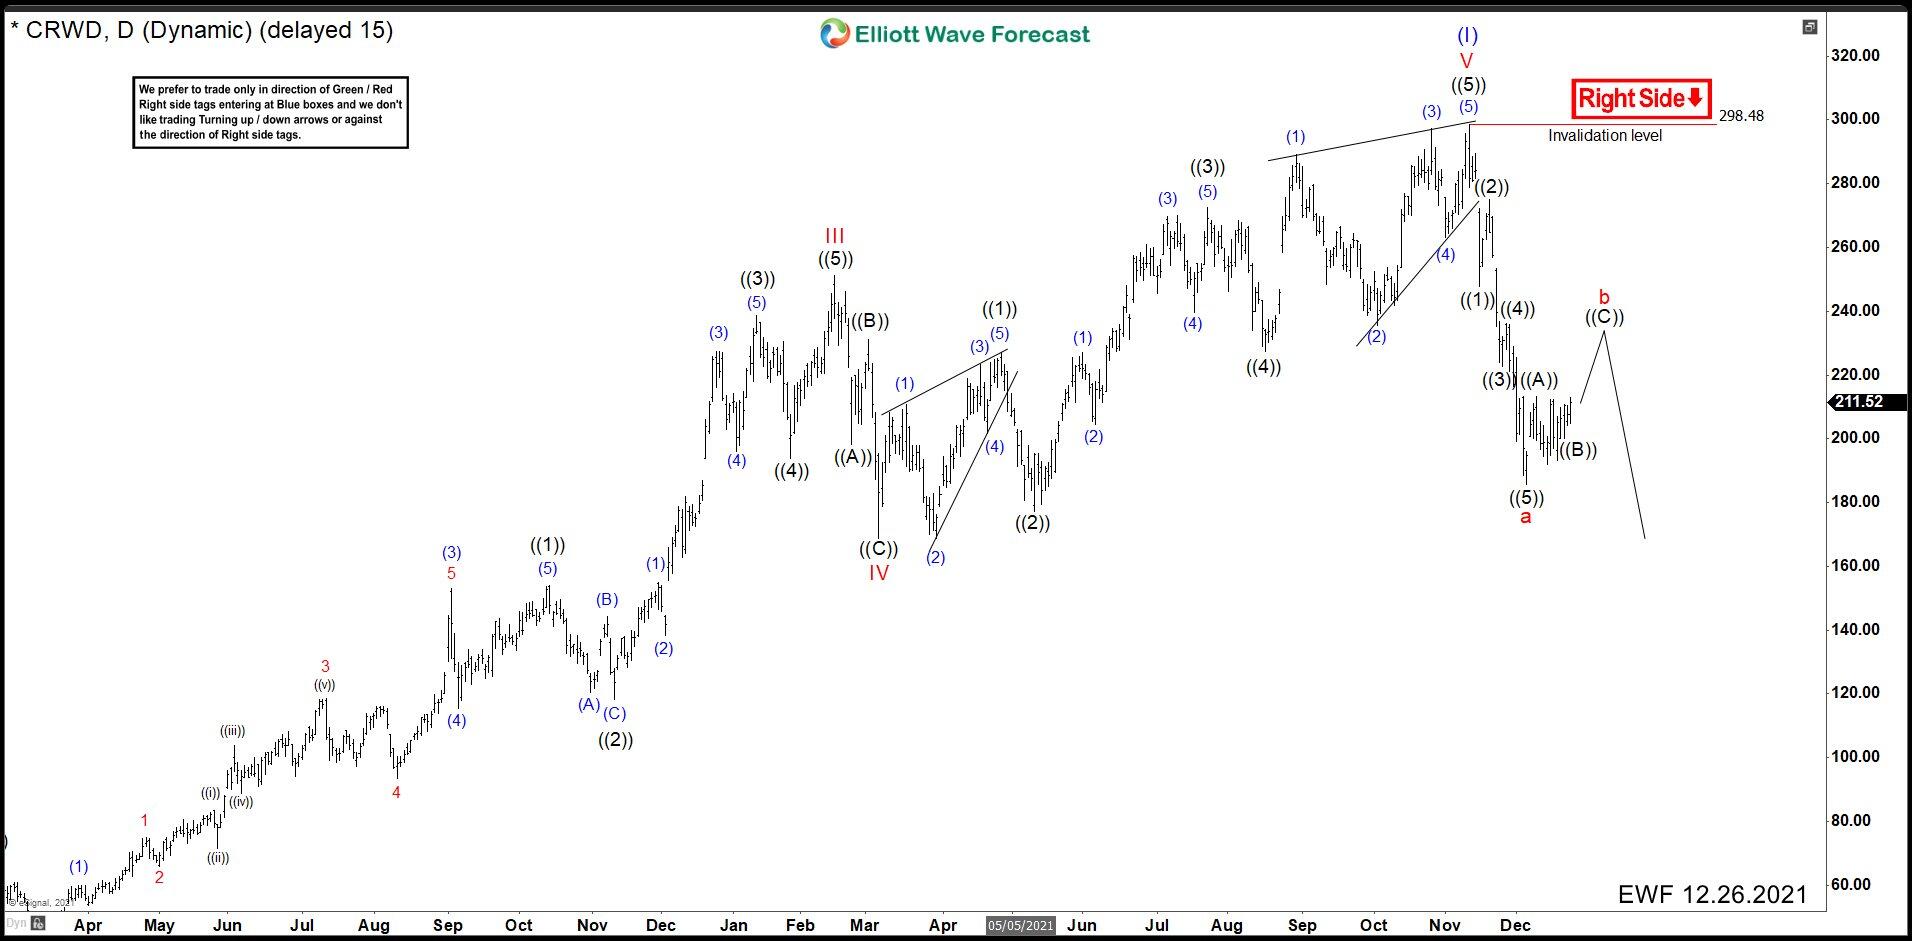
The dip was very strong and in 3 weeks CRWD hit 185.71 losing 37.78%. We change our first view for a possible wxy correction to an abc correction and marked an impulse structure from the top ending wave “a” at 185.71. We suggested a pullback in wave “b” before continuing with the downtrend.
CrowdStrike (CRWD) January daily chart
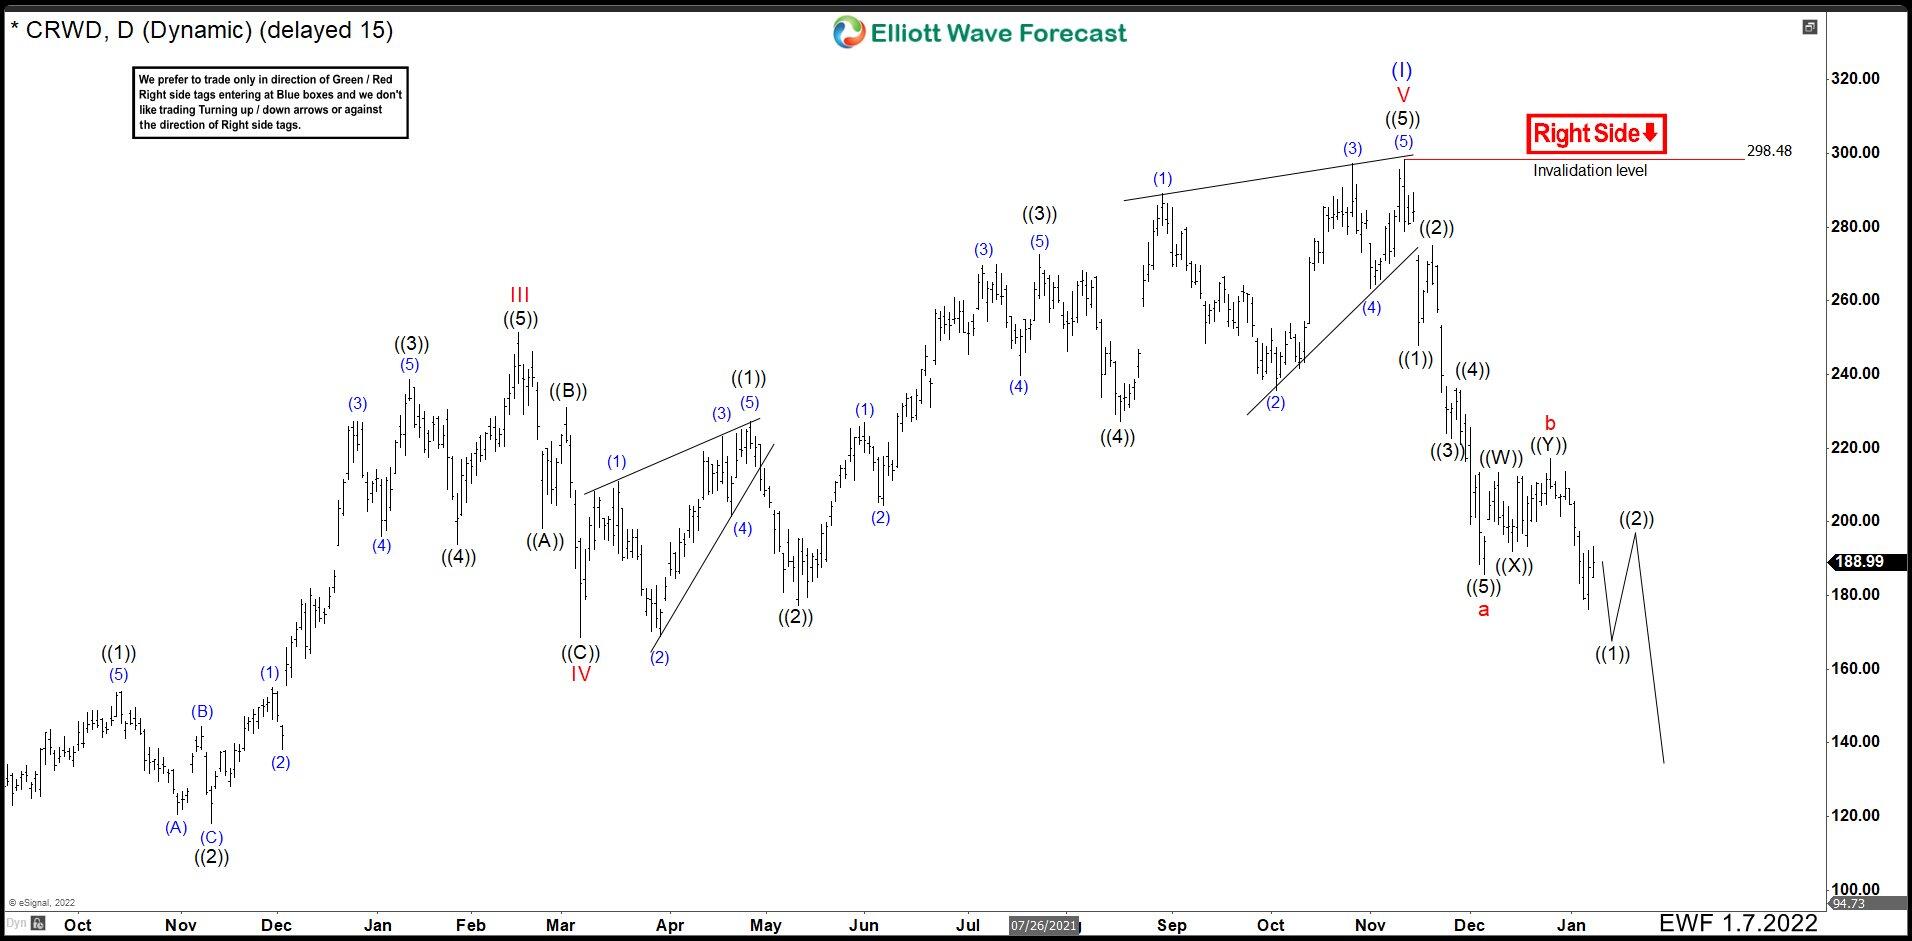
The corrective wave “b” was small ending at 217.11 and CRWD kept dropping. Therefore, we began to build the next impulse to complete wave “c” the last one of the abc correction and finish the whole correction as wave (II). We were calling one more low to end wave ((1)) and an correction as wave ((2)) to then see further downside in the stock.
CrowdStrike (CRWD) February 12th daily chart
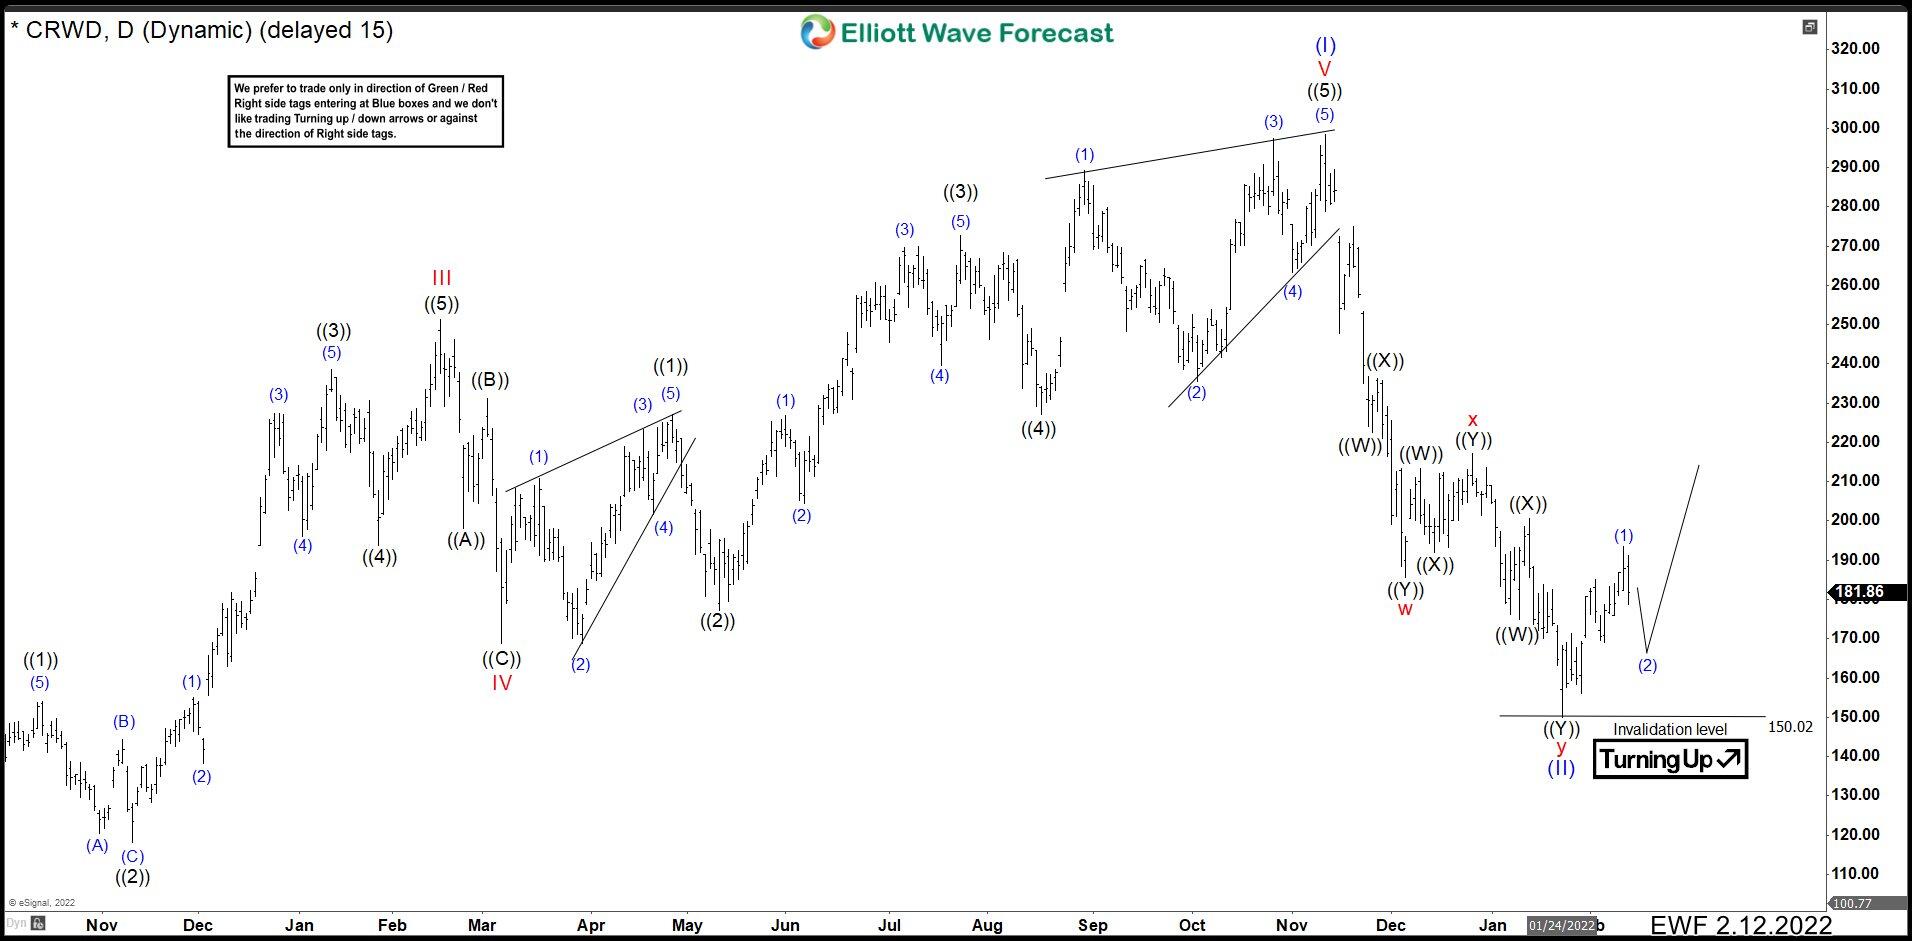
After 3 swings down from wave “b”, CRWD bounced from 150.02 and the rally were stronger that we thought. That made us to return to the original plan of a wxy correction and we labeled the fall in that way, given the end of the wxy structure and wave (II) at 150.02. From here, the rally looks like as a leading diagonal ending the wave (1) at 193.40. Currently, we are developing wave (2) pullback and as we stay above 150.02 we should continue with the rally.
To conclude, there is still a probability to see 3 swings more down in CRWD. That is a ((W)), ((X)), ((Y)) structure from wave “b”. Wave ((W)) could have ended at 150.02 then wave ((X)) ended at 193.40 and we need 3 swings more to complete the fractal and the corrective wave (II). Thus, we are looking to complete wave (2) and continuing with the rally as we stay above 150.02. In case the invalidation level gives up, we could continue down to 110.90 – 126.64 area in 3 swings more and from there resume the rally. This is a nice possibility for a long-term trade in this stock.
Author

Elliott Wave Forecast Team
ElliottWave-Forecast.com


