HDFC Life Insurance Elliott Wave technical analysis [Video]
![HDFC Life Insurance Elliott Wave technical analysis [Video]](https://editorial.fxstreet.com/images/TechnicalAnalysis/ChartPatterns/Candlesticks/foreign-exchange-market-chart-24348895.jpg)
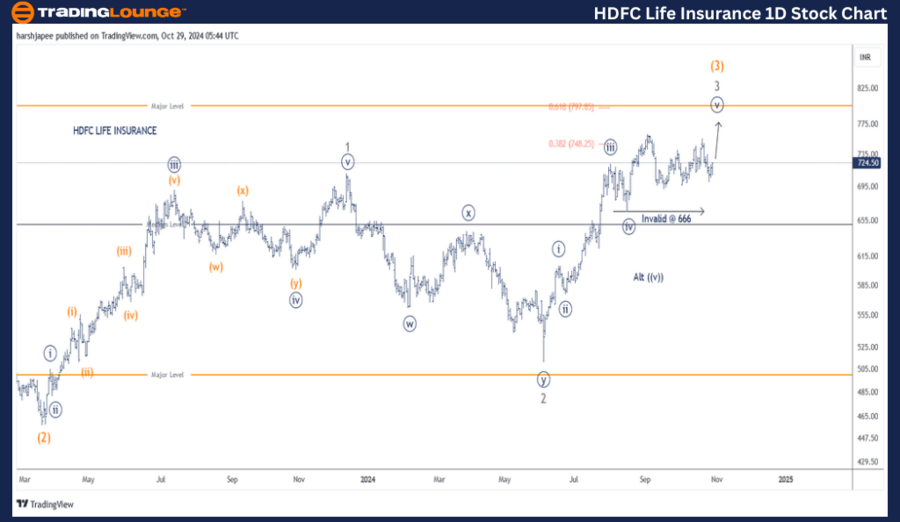
HDFCLIFE Elliott Wave technical analysis
Function: Larger Trend Higher (Intermediate degree Wave (3), orange)
Mode: Motive
Structure: Impulse
Position: Minute Wave ((v)) Navy
Details: Minute Wave ((v)) Navy is progressing higher within Minor Wave 3 Grey of Intermediate Wave (3) Orange. Potential upside target is seen towards 797 mark. No change.
HDFC Life Insurance daily chart technical analysis and potential Elliott Wave counts:
HDFC Life Insurance daily chart is indicating potential rally towards 797 mark in the near term as Minute Wave ((v)) of Minor Wave 3 of Intermediate Wave (3) unfolds against 666. A break below 666 would confirm the alternate count where Minute Wave ((v)) looks complete through 765.
The stock had carved a low around 455 in March 2023, marked as Intermediate Wave (2) Orange o the daily chart. Since then Minor Wave 1 Grey terminated around 711, while Minor Wave 2 unfolded as a combination ((w))-((x))-((y)) terminating around 510 mark.
Further, Minor Wave 3 has been unfolding against 510 with Minute Waves ((i)) through ((iv)) complete. If the above is correct, Minute Wave ((v)) is now progressing towards 797 against 666 support.
HDFCLIFE Elliott Wave technical analysis
Function: Larger Trend Higher (Intermediate degree Wave (3), orange).
Mode: Motive.
Structure: Impulse.
Position: Minute Wave ((v)) Navy.
Details: Minute Wave ((v)) Navy is progressing higher within Minor Wave 3 Grey of Intermediate Wave (3) Orange. Potential upside target is seen towards 797 mark. A break below 666 would confirm that Minute Wave ((v)) might be complete around 760-65.
Invalidation point: 666, Risk tightened.
HDFC Life Insurance four-hour chart technical analysis and potential Elliott Wave counts:
HDFC Life Insurance 4H chart highlights sub waves since Minor Wave 2 Grey terminated around 510 on June 04, 2024. As marked here, Minute Waves ((i)) through ((iv)) seems to be complete and Wave ((v)) is now progressing higher towards 797 mark, the fibonacci 0.618 extension.
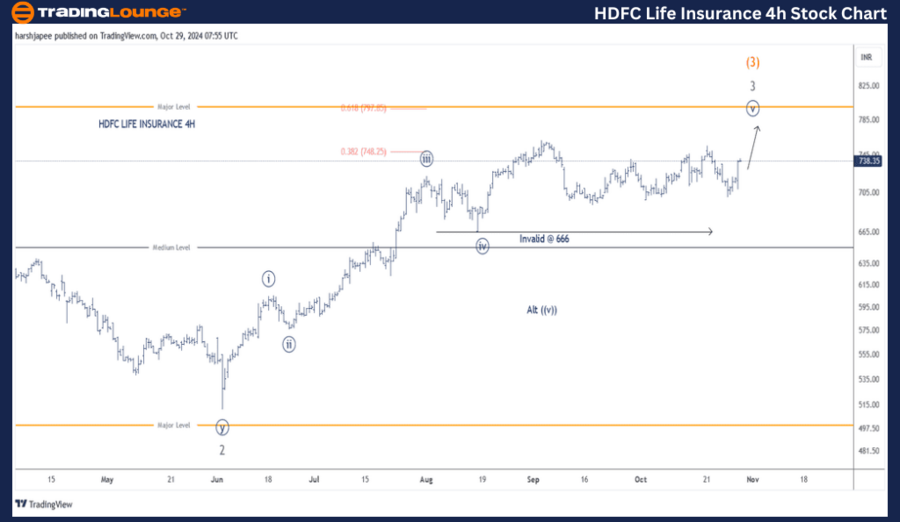
Conclusion
HDFC Life Insurance is progressing higher towards 797 mark as Minute Wave ((v)) unfold within Minor Wave 3 Grey of Intermediate Wave (3) Orange.
HDFC Life Insurance Elliott Wave technical analysis [Video]
Author

Peter Mathers
TradingLounge
Peter Mathers started actively trading in 1982. He began his career at Hoei and Shoin, a Japanese futures trading company.


