HDFC Bank Elliott Wave technical analysis [Video]
![HDFC Bank Elliott Wave technical analysis [Video]](https://editorial.fxstreet.com/images/TechnicalAnalysis/Volume/Liquidity/withdraw-money-in-banknotes-from-an-atm-gm499448991-42641844_XtraLarge.jpg)
HDFCBANK Elliott Wave technical analysis
Function: Larger Degree Trend Higher (Intermediate degree, orange).
Mode: Motive.
Structure: Impulse.
Position: Minute Wave ((v)) Navy progressing higher.
Details: Minute Wave ((v)) Navy, progressing higher within Minor Wave 3 Grey of Intermediate Wave (5) Orange against 1590. Further, Minuette Wave (v) Orange could resume higher soon.
Invalidation point: 1590.
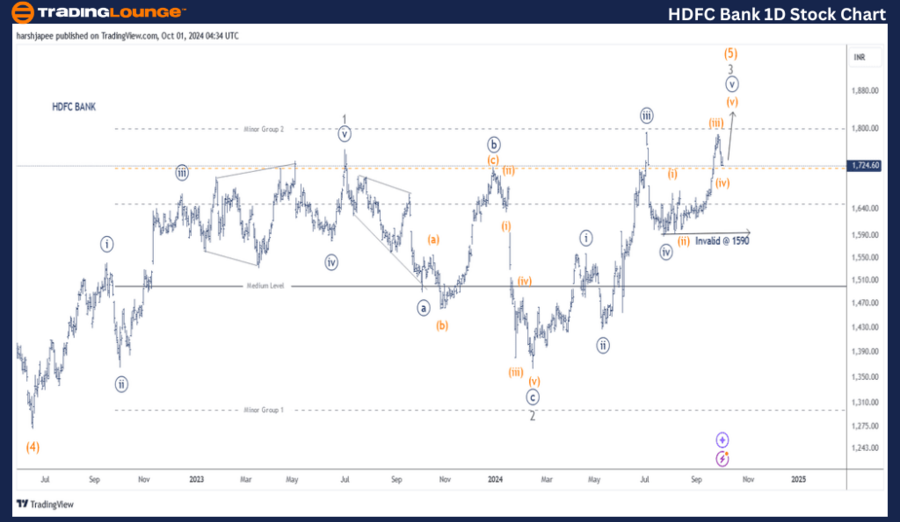
HDFC Bank daily chart technical analysis and potential Elliott Wave counts
HDFC Bank daily chart is indicating a progressive rally, which could be unfolding Minor Wave 3 Grey within Intermediate Wave (5) Orange against 1365 lows medium term. Minute Wave ((v)) could be unfolding now or Minute Wave ((iii)) could be extending against 1590.
The stock had print lows around 1270 mark in June 2022, terminating Intermediate Wave (4) Orange as marked. Minor Waves 1 and 2 Grey terminated around 1765 and 1265 levels respectively. Since then Minor Wave 3 Grey is unfolding and prices should ideally stay above 1265.
We shall change the degree of sub waves within Minor Wave 3 if required as price action unfolds. High probability remains for Minute Wave ((iii)) to be extended. A push above 1970 would be minimum expectation for Minute Wave ((v)) to complete.
HDFCBANK Elliott Wave technical analysis
Function: Larger Degree Trend Higher (Intermediate degree, orange).
Mode: Motive.
Structure: Impulse.
Position: Minute Wave ((v)) Navy progressing higher.
Details: Minute Wave ((v)) Navy, progressing higher within Minor Wave 3 Grey of Intermediate Wave (5) Orange against 1590. Further, Minuette Wave (v) Orange could resume higher within Minute Wave ((v)) Navy.
Invalidation point: 1590.
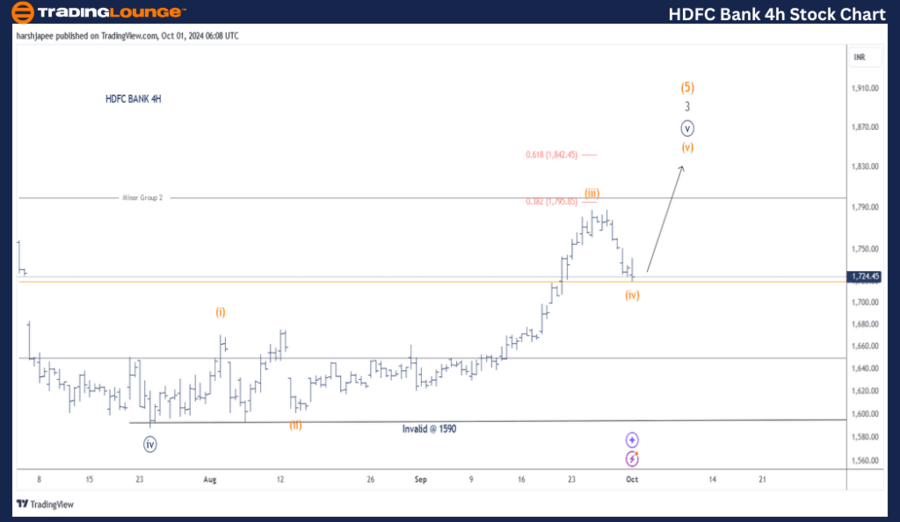
HDFC Bank four-hour chart technical analysis and potential Elliott Wave counts
HDFC Bank 4H highlights sub waves with Minute Wave ((v)) Navy since 1590 lows. Minuette Waves (i) through (iv) Orange might be complete as bulls prepare to come back in control from close to 1710-20 range. A push above 1800 mark should accelerate further.
Conclusion
HDFC Bank is progressing within Minute Wave ((v)) of Minor Wave 3 Grey as Intermediate Wave (5) Orange unfolds towards 1970-2000 range. Alternatively, a break below 1590 will change the medium term outlook.
HDFC Bank Elliott Wave technical analysis [Video]
Author

Peter Mathers
TradingLounge
Peter Mathers started actively trading in 1982. He began his career at Hoei and Shoin, a Japanese futures trading company.


