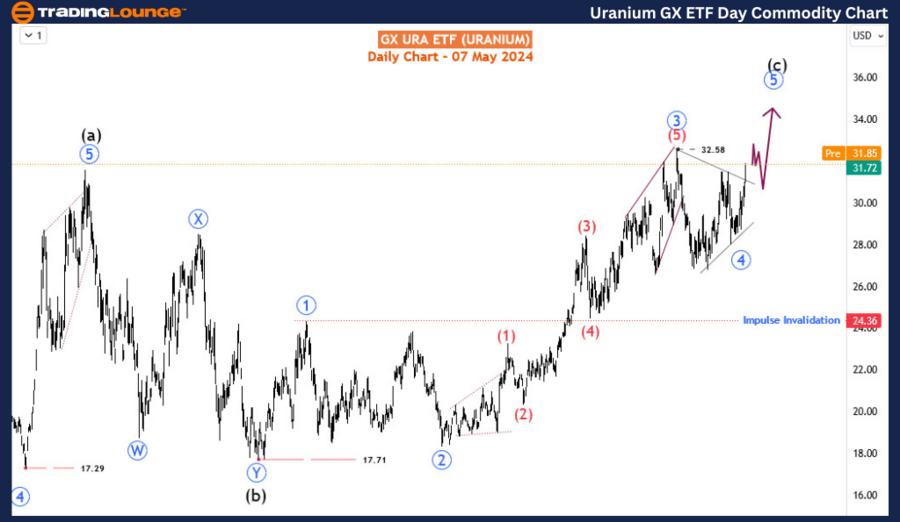
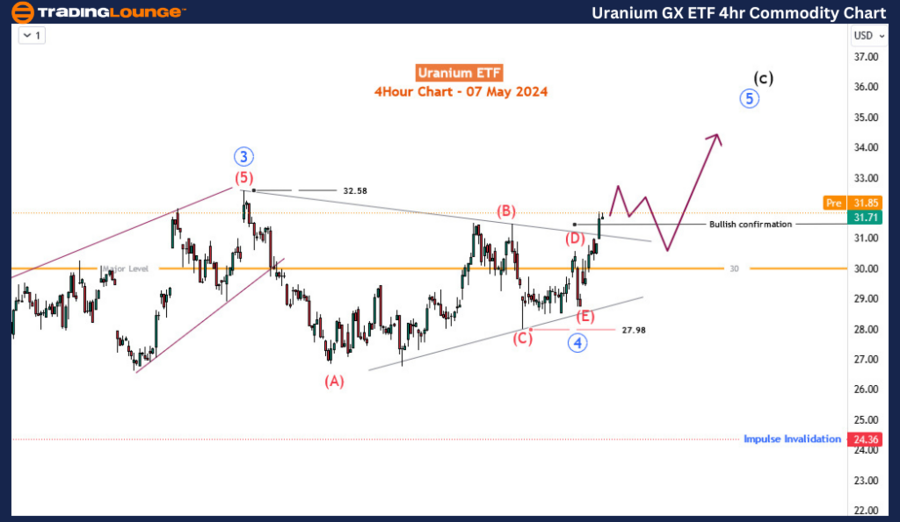
GX Uranium ETF (URA) Elliott Wave analysis

Function - Counter trend.

Mode - Corrective.

Structure - Zigzag for 4. Impulse for (A).

Position - Wave 5 of (A).

Direction -  Wave 5 of (A) is still in play.

Details - The blue wave 4 triangle has been completed with confirmation above wave (B) high. Wave ‘5’ appears to have begun. Invalidation is now at wave (E) low. Price may retest toward the 30 major level before blue wave ’5’ continues.

The GX URA ETF, known as the Global X Uranium ETF, is an investment fund designed to track the performance of companies involved in the uranium industry. This exchange-traded fund (ETF) offers investors exposure to a diversified portfolio of global uranium mining, exploration, and production companies. With growing interest in nuclear power as a cleaner energy source and the potential for increased demand for uranium, the GX URA ETF provides investors with an opportunity to participate in this sector's growth.

After moving sideways for three months, the URA ETF is attempting an upside breakout as traders add to LONGs and exit SHORTs to extend the bullish impulse sequence that started in August 2022. The price is expected to attempt to reach a new high in 2024. From the Elliott wave perspective, we can expect the price to surpass the February 2024 high.

On the attached daily chart, a clear bullish impulse wave structure emerged from 17.71 in August 2022. It completed the 3rd wave - primary wave 5 (circled in blue) in February 2024 and then moved sideways to complete a triangle structure for the corresponding 4th wave - blue wave 4. The 4th wave - blue wave 5 is now emerging and should reach a new high for the year.

The H4 chart shows the sub-waves of the triangle 4th wave subdivided into five 3-waves within two contracting opposite lines. Primary degree wave 5 (circled in blue) is expected to continue higher toward 36-36. However, the price might pull back toward the 30.00 major level before the rally continues. This forecast will remain valid as long as the price remains above the 27.98 major level.

Chart


Chart

GX Uranium ETF (URA) Elliott Wave technical analysis [Video]

Share: Feed news

As with any investment opportunity there is a risk of making losses on investments that Trading Lounge expresses opinions on.

Historical results are no guarantee of future returns. Some investments are inherently riskier than others. At worst, you could lose your entire investment. TradingLounge™ uses a range of technical analysis tools, software and basic fundamental analysis as well as economic forecasts aimed at minimizing the potential for loss.

The advice we provide through our TradingLounge™ websites and our TradingLounge™ Membership has been prepared without considering your objectives, financial situation or needs. Reliance on such advice, information or data is at your own risk. The decision to trade and the method of trading is for you alone to decide. This information is of a general nature only, so you should, before acting upon any of the information or advice provided by us, consider the appropriateness of the advice considering your own objectives, financial situation or needs. Therefore, you should consult your financial advisor or accountant to determine whether trading in securities and derivatives products is appropriate for you considering your financial circumstances.

Recommended content


Recommended content

Editors’ Picks

EUR/USD retreats toward 1.0850 on modest USD recovery

EUR/USD retreats toward 1.0850 on modest USD recovery

EUR/USD stays under modest bearish pressure and trades in negative territory at around 1.0850 after closing modestly lower on Thursday. In the absence of macroeconomic data releases, investors will continue to pay close attention to comments from Federal Reserve officials.

EUR/USD News

GBP/USD holds above 1.2650 following earlier decline

GBP/USD holds above 1.2650 following earlier decline

GBP/USD edges higher after falling to a daily low below 1.2650 in the European session on Friday. The US Dollar holds its ground following the selloff seen after April inflation data and makes it difficult for the pair to extend its rebound. Fed policymakers are scheduled to speak later in the day.

GBP/USD News

Gold climbs to multi-week highs above $2,400

Gold climbs to multi-week highs above $2,400

Gold gathered bullish momentum and touched its highest level in nearly a month above $2,400. Although the benchmark 10-year US yield holds steady at around 4.4%, the cautious market stance supports XAU/USD heading into the weekend.

Gold News

Chainlink social dominance hits six-month peak as LINK extends gains

Chainlink social dominance hits six-month peak as LINK extends gains

Chainlink (LINK) social dominance increased sharply on Friday, exceeding levels seen in the past six months, along with the token’s price rally that started on Wednesday. 

Read more

Week ahead: Flash PMIs, UK and Japan CPIs in focus – RBNZ to hold rates

Week ahead: Flash PMIs, UK and Japan CPIs in focus – RBNZ to hold rates

After cool US CPI, attention shifts to UK and Japanese inflation. Flash PMIs will be watched too amid signs of a rebound in Europe. Fed to stay in the spotlight as plethora of speakers, minutes on tap.

Read more

Forex MAJORS

Cryptocurrencies

Signatures