|

Gold Technical Analysis: Traders await a convincing break through near-term trading range

   •  The commodity remains confined within a broader trading range, held over the past week or so, and hangs near YTD lows set early this month.

   •  The near-term range play constitutes towards the formation of a rectangular chart pattern on the 1-hourly chart, indicating consolidation phase before the next leg of directional move. 

   •  Short-term technical indicators on the daily chart are still holding in negative territory and thus, increase prospects for a bearish breakdown.

   •  However, it would be prudent to wait for a convincing breakthrough the trading range support, near the $1206 area, before positioning for any further near-term depreciating move. 

Gold 1-hourly chart
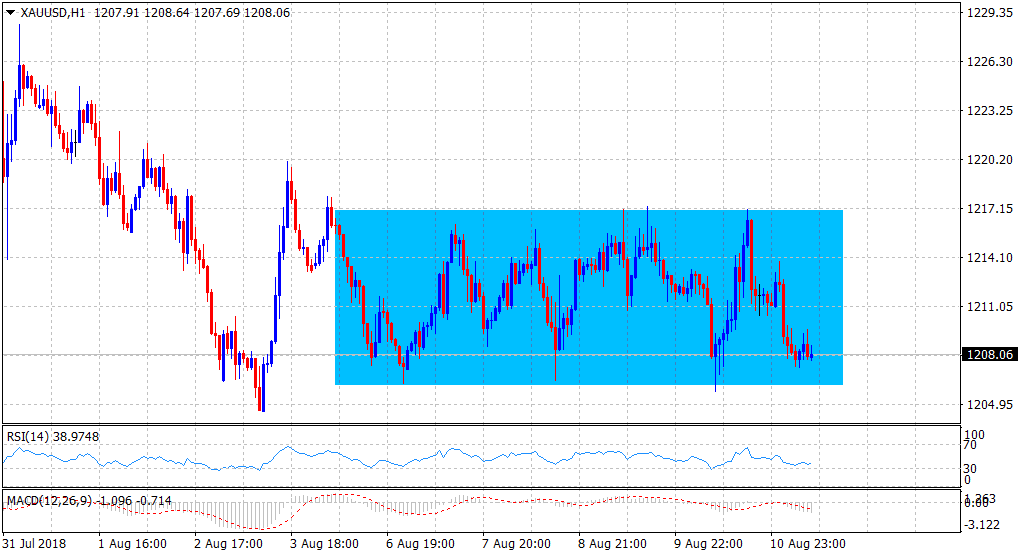
Spot Rate: $1208
Daily High: $1213.88
Daily Low: $1207.25
Trend: Bearish below $1206

Resistance
R1: $1214 (current day swing high)
R2: $1217 (one-week old trading range hurdle)
R3: $1228 (July 31 swing high)

Support
S1: $1205 (17-month low set on August 3)
S2: $1200 (psychological round figure mark)
S3: $1195 (March 2017 swing low)
 

Author

Haresh Menghani

Haresh Menghani is a detail-oriented professional with 10+ years of extensive experience in analysing the global financial markets.


More from Haresh Menghani
Share:

Editor's Picks

GBP/USD gathers strength to near 1.3550 as Fed hike bets fade, UK jobs data loom

The GBP/USD pair gains momentum to around 1.3550 during the early Asian trading hours. The US Dollar softens against the British Pound as cooler US inflation data have prompted traders to reduce bets on a US Federal Reserve rate hike. The UK employment report will be in the spotlight later on Tuesday.

EUR/USD flat lines below two-month high amid oil-driven inflation fears

The EUR/USD pair holds steady around the 1.1575-1.1580 region during the Asian session, and for now seems to have stalled the previous day's modest pullback from a two-month top. However, a modest US Dollar uptick warrants some caution before positioning for the resumption of the recent move higher from the 1.1350 area, or the July monthly swing low.

Gold bulls take a breather before the next push higher

Gold is retreating after hitting three-day highs just below $4,450 early Tuesday, and is flirting with $4,400 as of writing. Gold bulls take a breather following two consecutive days of gains, assessing the impact of the truce lapse between the United States (US) and Iran on Oil prices and US Treasury bond yields.

Bitcoin rebounds while Polygon, Zcash lead gains
The broader cryptocurrency market shows a mild easing in the persistent risk-off sentiment, with Bitcoin (BTC) rising above $64,000. Polygon (POL) and Zcash (ZEC) have emerged as top performers over the last 24 hours, with bulls eyeing further gains. CoinMarketCap’s Fear and Greed Index at 40 on Tuesday suggests a mild recovery from risk-averse conditions.
Silver’s new era: Supply deficits meet exploding industrial demand
Silver has experienced a wild ride in 2026, but The Silver Institute President and CEO Michael DiRienzo says investors shouldn’t let the volatility obscure a much bigger story: the underlying silver market remains remarkably strong.
Why is Crude Oil priced for a reopening the ships haven't made?
Fourteen vessels crossed the Strait of Hormuz on Tuesday. Before the war, the count ran near 120 a day. In the sessions since the waterway was publicly declared open, Brent has drifted back to $87 and West Texas Intermediate (WTI) to $81, both a little lower again on Wednesday, with daily momentum on each unwound from the top of its range in late July to the low twenties now.















