|
Gold Technical Analysis: Bears betting on a break below $1,290.00/oz

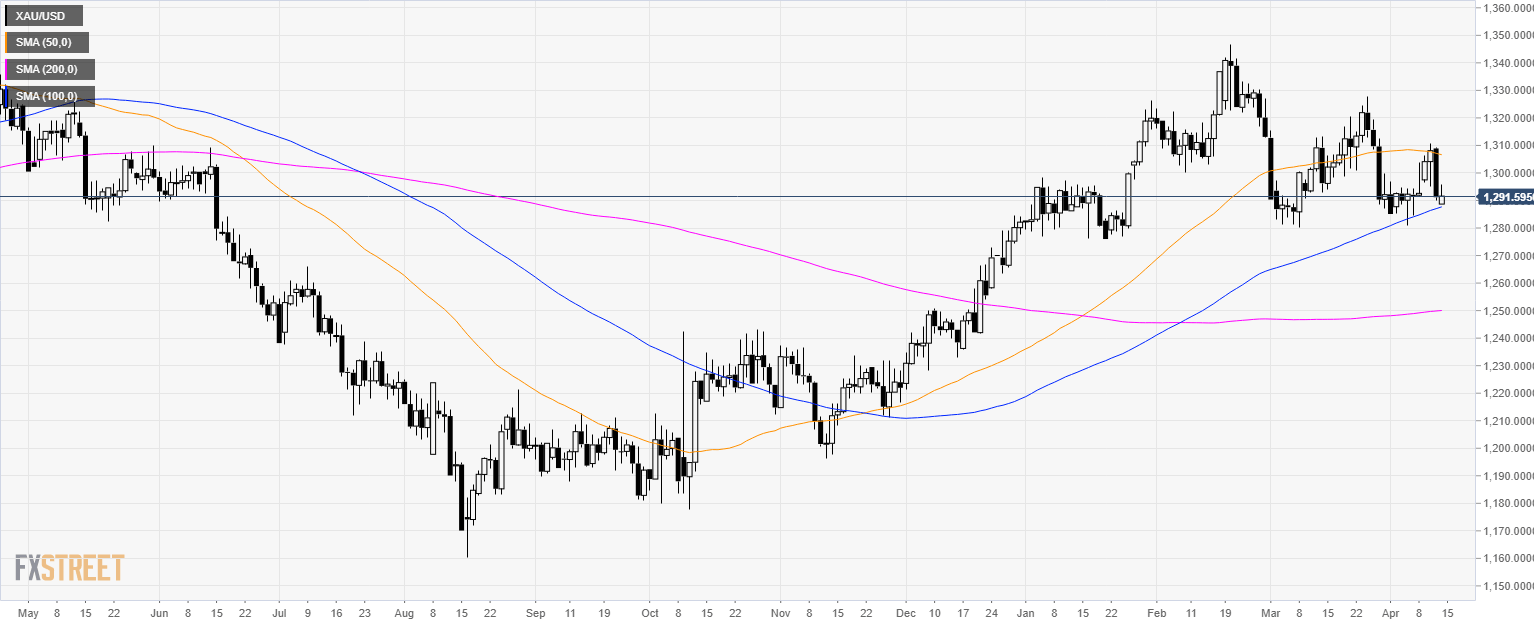
Gold daily chart
- Gold is trading in a bull trend above its 100 and 200 simple moving averages (SMAs).
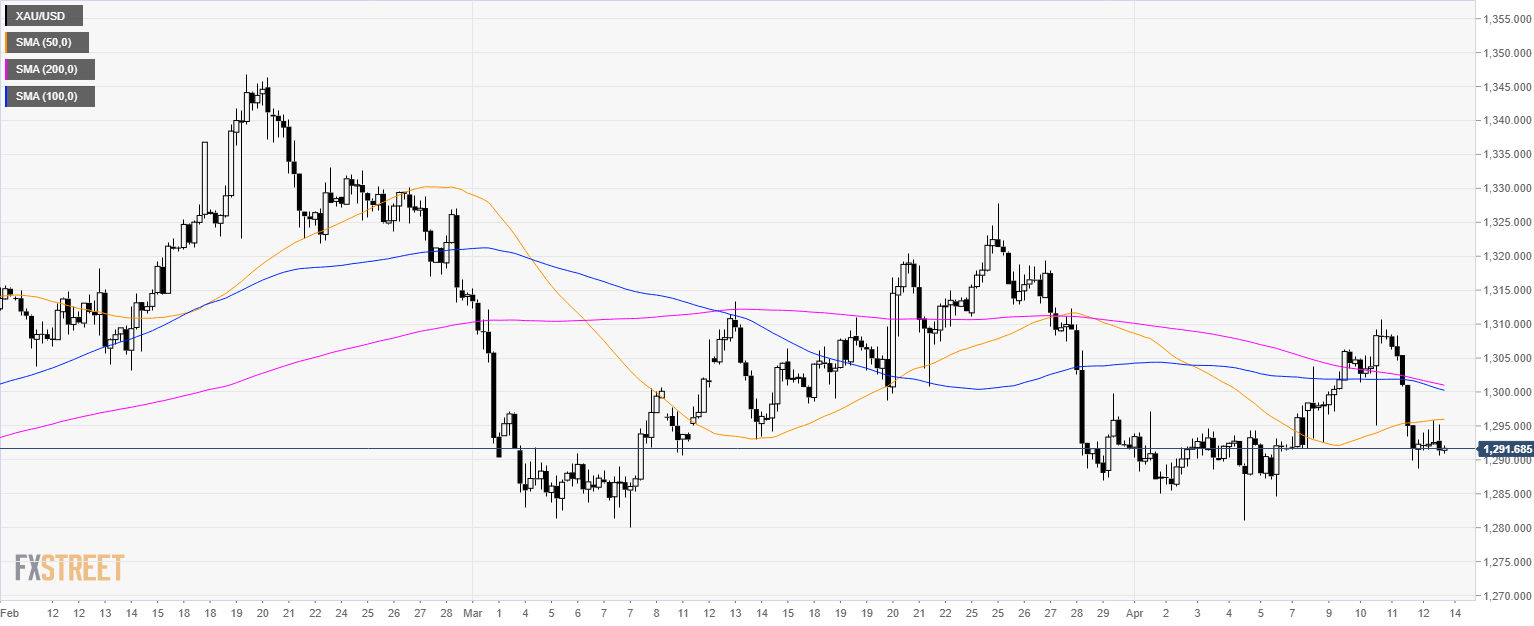
Gold 4-hour chart
- Gold is trading below its main SMAs suggesting a bearish bias in the medium-term.
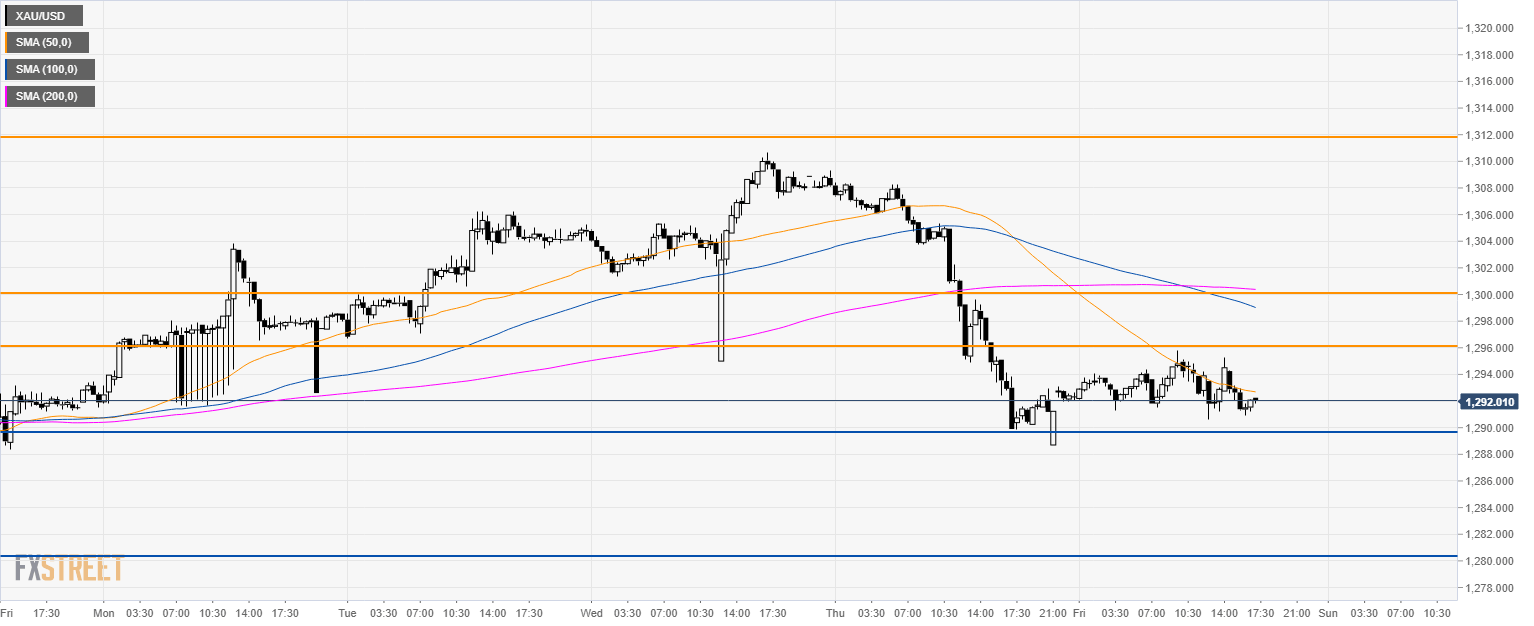
Gold 30-minute chart
- Gold is trading below its main SMAs suggesting bearish momentum in the short-term.
- Bears are eagerly looking for a break below 1,290.00 support. A break below the level can lead to 1,280.00 and 1,270.00 level.
- Resistance is at 1,296.00 and 1,300.00 figure.
Additional key levels
Author

Flavio Tosti
Independent Analyst
More from Flavio Tosti


